Volume in the Forex markets - useful or not?

As traders, we’re always looking for useful data that might give us an extra edge. That’s even truer for technical/price focused traders where all we have is the open, high, low and close of a market (or tick data, but that usually ends up in some similar transformation as OHLC data). Sure there are thousands of indicators but these are all just transformations of that price data.
Now in many markets volume can be a useful addition to that. Knowing if there was heavy trading within a certain time period or not can be valuable information. It can be used as a filter for trade signals, looking for strong volume on a breakout for example. But there’s also a couple of volume based indicators that incorporate volume in a useful way.
In the futures markets, when you look at the volume you actually see how many contracts have been traded at the exchange during that time period. And you see all of it, of all market participants in that market as there’s just one exchange.
But Forex trading is decentralized, OTC trading. There is no single place to look at to see the actual volume of a currency pair. That’s why it’s often said that the volume provided by your broker is pretty useless. All you would see is the trading volume that happened at your broker, either between clients and liquidity providers in an ECN or if you’re trading at a market maker between your broker and it’s clients. But retail traders are not moving the markets, their volume is totally meaningless in a such a big marketplace.
And of course, the institutional traders that are responsible for the volume that matters don’t trade at a retail broker. They’re on Reuters, EBS or just trading directly with other banks/institutions. So if you just see the volume that happened at your retail broker, it’s useless information right? That’s what I thought too and so I never paid much attention to volume in FX.
Until recently when CLS FX volume data became available for the retail customer over at Quandl. CLS runs the largest FX settlement service in the world and therefore they have the information we’re looking for. Institutional Forex trading volume, the volume that actually matters and moves the markets. Now CLS does a great job here and as always, it’s super easy to use the data via Quandl. So if you can afford it, I think that data is the best forex volume data you can get and that is well worth its price.
So once that real volume data was available, I, of course, got very excited and curious. Maybe it was time to have another look at volume data in the Forex markets. How would the CLS volume data compare to different brokers data? What is it actually that you see at your broker? And how does it compare to the Futures contracts?
Two brokers that offer volume data and I already had an API to connect to are Oanda and Dukascopy. So I downloaded their data, merged both to the same daily time periods and compared them. The first surprise for me was that it was almost identical (over 90% correlated). So I decided to read more about that data and found out that what they’re providing is actually „tick volume“ data. This means that whenever there’s a new quote from the source they’re using (Oanda probably uses Reuters and other similar data feeds, Dukascopy offering ECN trading probably use the quotes of each of their liquidity providers) that would make the volume go higher. That of course strongly increases the odds of their volume data actually being useful. It would mean that what we’re seeing is not what’s going on between them and their clients but on their quote data sources. And that indeed might be informative.
But is it? As traders we never want to rely on an assumption, we want actual numbers that proves our idea right or wrong. So let's find out! The first step was to get one of the free samples of CLS data available at Quandl. I picked the daily GBP/JPY spot data and compared it to Oanda's tick volume data.
First of all the actual absolute numbers are of course totally different. And if that's what you need, CLS is the only way to go. But as traders what we usually are interested in is „Is today's volume above/below average?“ or „Is today's volume some standard deviation above/below average?“ and so forth. And for this we're fine as long as the data is correct on a normalized basis.
Here’s a graph of GBP/JPY volume from CLS and Oanda plotted on two Y axis (CLS left, Oanda right):
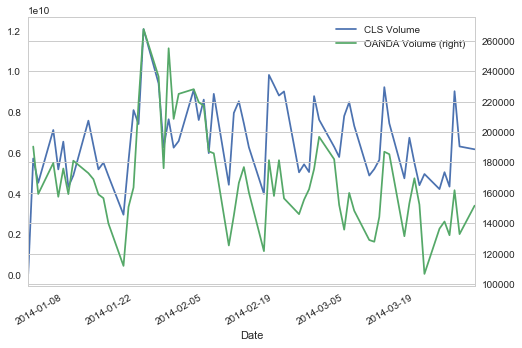
So again, yes the absolute numbers are totally different but on a relative basis, looking for volume rising/falling and most of the spikes they look quite similar.
Looking at the same data showing the percent change between each day that becomes even more clear:
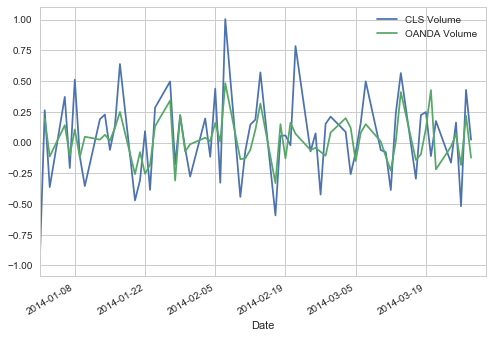
Now there are differences, but as you can see they’re highly correlated. Which leads me to the conclusion that FX brokers data might indeed be of some value.
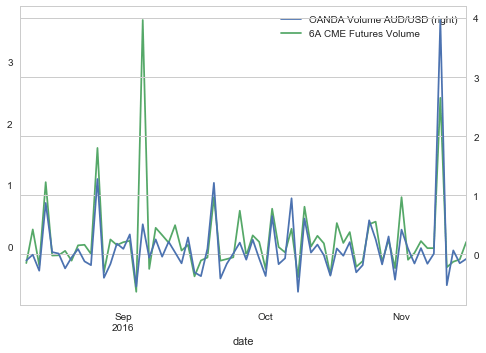
My next idea was to compare one of the spot Forex markets to a futures market. I picked AUD/USD spot FX, again using Oanda data and the Australian Dollar Future (6A) traded at the CME.
Again, on a relative basis looking at the percent change of day to day volume we get another confirmation:
Conclusion: Surprise! As so often in trading the result of that little investigation is very different from what I expected. The FX volume data provided by your broker/ECN might indeed be valuable information!
Happy Trading!
Author

Marco Mayer
Algostrats


