![]() Gabe Velázquez
Gabe Velázquez
Online Trading Academy
In the last week, volatility in the equity futures contracts has increased markedly. This happened over a period of just seven trading days. The Chicago Board of Options Volatility Index, also known as the VIX, jumped approximately 60% in that short spell, going from a reading of 12.75 to 20. For some traders this sudden increase in the rate of change in the stock market can be unsettling.
For those of you that may be new to trading, let me explain what the VIX index specifically measures and why you should track it as part of your trading process. The VIX is an index that measures the implied volatility for the S&P 500 index going out 30 days. This is done by tracking how much options traders are willing to pay for insurance against a decline in the stock market. Insurance is a fitting term, as the amount traders pay for purchasing these options is called a premium. Similar to what you pay to insurance companies when you want to insure your automobile or home.
These options are called Puts and are purchased by those that want the right, but not the obligation, to the sell the S&P 500 index for a specific price and time. The way it works is simply a function of supply and demand in the traditional sense. For instance, if the market starts to fall, traders and investors become nervous and buy put protection against their holdings, thus pushing premiums higher. As the market accelerates its decline, the demand for these puts increases sending the VIX index higher. The latest decline in stocks has done exactly that. As we see in the chart below, lower markets correlate to a higher VIX index.

So what does the latest bout of selling and increase in volatility in the equity index futures mean for traders? The first thing I tell students at Online Trading Academy is to stay the course. What I mean by this is that one should not bounce around from strategy to strategy because the market is moving faster. I say this because that’s the first tendency traders have when the environment changes. I would suggest that volatility is good provided you know what you’re doing in regards to finding low risk opportunities. This is why our patented strategy of supply and demand works well in these types of surroundings.
I would add that there are some adjustments that need to me made in regard to trading time frames, but sticking to the core strategy is very important.
The first adjustment in this regard is to look at larger time frames. This is to determine when the decline is likely to change directions. An example of that would be in the Nasdaq futures. In last September’s sell-off and spike in volatility, the selling was arrested at the daily demand zone seen on the chart below:
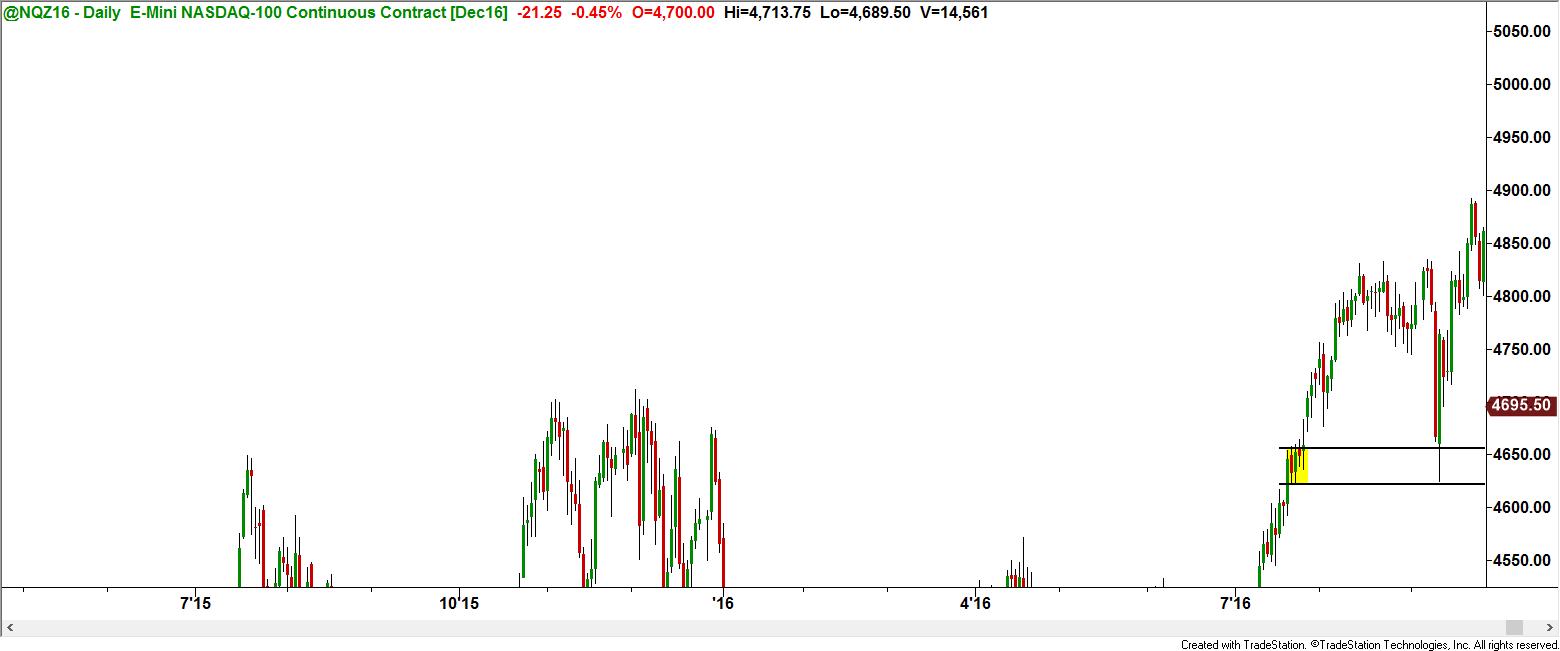
I suspect that this recent spate of selling will culminate in a daily or weekly area of demand. Coincidentally, The VIX index peaked at 20 at the time of the September rebound. Why is this information important you might ask? Well, that’s because too many traders blindly follow the trend and are usually very late in figuring out when the trend has changed. This type of trading does not afford low risk trading opportunities. Moreover, this gives traders a false sense of security as they feel safer in trading when markets are trending and are experiencing low levels of volatility.
The bottom line is that if treated correctly, volatility should be a friend and not a foe to traders. In my experience you should expect more volatility in the new year as the markets have spent many months this year marked by historically low levels of volatility. I say this because this usually portends months of heightened volatility. If I’m correct I would ask, are you’re properly prepared for this type environment? If the answer is no, then stay on the sidelines. If the answer is yes, then get ready for some great opportunities coming in the near future.
Until next time, I hope everyone has a great week.
This content is intended to provide educational information only. This information should not be construed as individual or customized legal, tax, financial or investment services. As each individual's situation is unique, a qualified professional should be consulted before making legal, tax, financial and investment decisions. The educational information provided in this article does not comprise any course or a part of any course that may be used as an educational credit for any certification purpose and will not prepare any User to be accredited for any licenses in any industry and will not prepare any User to get a job. Reproduced by permission from OTAcademy.com click here for Terms of Use: https://www.otacademy.com/about/terms
Editors’ Picks

EUR/USD hits two-day highs near 1.1820
EUR/USD picks up pace and reaches two-day tops around 1.1820 at the end of the week. The pair’s move higher comes on the back of renewed weakness in the US Dollar amid growing talk that the Fed could deliver an interest rate cut as early as March. On the docket, the flash US Consumer Sentiment improves to 57.3 in February.

GBP/USD reclaims 1.3600 and above
GBP/USD reverses two straight days of losses, surpassing the key 1.3600 yardstick on Friday. Cable’s rebound comes as the Greenback slips away from two-week highs in response to some profit-taking mood and speculation of Fed rate cuts. In addition, hawkish comments from the BoE’s Pill are also collaborating with the quid’s improvement.

USD/JPY drops back below 157.00, as focus shifts to Japan snap election
USD/JPY is back in the red below 157.00 in the Asian session on Friday. The Japanese Yen recovers ground against the US Dollar amid some profit-taking ahead of Japan's snap general election on Sunday. The preliminary reading of the Michigan Consumer Sentiment Index report for February will be released later on Friday.
Editors’ Picks

EUR/USD: US Dollar to remain pressured until uncertainty fog dissipates Premium
The EUR/USD pair lost additional ground in the first week of February, settling at around 1.1820. The reversal lost momentum after the pair peaked at 1.2082 in January, its highest since mid-2021.

Gold: Volatility persists in commodity space Premium
After losing more than 8% to end the previous week, Gold (XAU/USD) remained under heavy selling pressure on Monday and dropped toward $4,400. Although XAU/USD staged a decisive rebound afterward, it failed to stabilize above $5,000.

GBP/USD: Pound Sterling tests key support ahead of a big week Premium
The Pound Sterling (GBP) changed course against the US Dollar (USD), with GBP/USD giving up nearly 200 pips in a dramatic correction.

Bitcoin: The worst may be behind us
Bitcoin (BTC) price recovers slightly, trading at $65,000 at the time of writing on Friday, after reaching a low of $60,000 during the early Asian trading session. The Crypto King remained under pressure so far this week, posting three consecutive weeks of losses exceeding 30%.

Three scenarios for Japanese Yen ahead of snap election Premium
The latest polls point to a dominant win for the ruling bloc at the upcoming Japanese snap election. The larger Sanae Takaichi’s mandate, the more investors fear faster implementation of tax cuts and spending plans.
RECOMMENDED LESSONS
Making money in forex is easy if you know how the bankers trade!
I’m often mystified in my educational forex articles why so many traders struggle to make consistent money out of forex trading. The answer has more to do with what they don’t know than what they do know. After working in investment banks for 20 years many of which were as a Chief trader its second knowledge how to extract cash out of the market.
5 Forex News Events You Need To Know
In the fast moving world of currency markets where huge moves can seemingly come from nowhere, it is extremely important for new traders to learn about the various economic indicators and forex news events and releases that shape the markets. Indeed, quickly getting a handle on which data to look out for, what it means, and how to trade it can see new traders quickly become far more profitable and sets up the road to long term success.
Top 10 Chart Patterns Every Trader Should Know
Chart patterns are one of the most effective trading tools for a trader. They are pure price-action, and form on the basis of underlying buying and selling pressure. Chart patterns have a proven track-record, and traders use them to identify continuation or reversal signals, to open positions and identify price targets.
7 Ways to Avoid Forex Scams
The forex industry is recently seeing more and more scams. Here are 7 ways to avoid losing your money in such scams: Forex scams are becoming frequent. Michael Greenberg reports on luxurious expenses, including a submarine bought from the money taken from forex traders. Here’s another report of a forex fraud. So, how can we avoid falling in such forex scams?
What Are the 10 Fatal Mistakes Traders Make
Trading is exciting. Trading is hard. Trading is extremely hard. Some say that it takes more than 10,000 hours to master. Others believe that trading is the way to quick riches. They might be both wrong. What is important to know that no matter how experienced you are, mistakes will be part of the trading process.
The challenge: Timing the market and trader psychology
Successful trading often comes down to timing – entering and exiting trades at the right moments. Yet timing the market is notoriously difficult, largely because human psychology can derail even the best plans. Two powerful emotions in particular – fear and greed – tend to drive trading decisions off course.