Using the Ichimoku Kinko Hyo with CFD trading

By Rob Jones
Trading CFDs is what is generally referred to as directional trading; while one can make money whether the price of the underlying asset goes up or down, this will only happen if the direction of the move can be correctly predicted.
Going long just before a price drop or going short before a price increase will have only one consequence: the trader will lose money.
Technical Indicators – the Ichimoku Kinko Hyo
There are literally hundreds of technical indicators out there that a trader can use to help predict market direction. One of them is the Ichimoku Kinko Hyo, which was developed in Japan during the previous century and which is gaining increasing popularity in the West because of its ability to identify trends.
The Ichimoku is actually a combination of different indicators that together form a formidable asset in many traders’ arsenals. With the help of this indicator it is possible to identify not only whether the market is in an up- or downtrend, but also where the vital support and resistance points can be found.
The indicator consists of five lines: The kijun-sen, tenkan-sen, senkou span A, senkou span B and chickou span. Fig. 11.05(a) is a candle stick price chart of the AUD/USD together with an Ichimoku Kinko Hyo chart
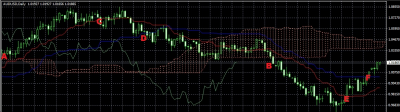
Fig. 11.05(a)
The Ichimoku Cloud is of paramount importance here. When the price is between the upper and lower levels of the cloud, i.e. inside the cloud, it is not recommended that the trader should enter into a new trade.
When the price breaks out from the top of the cloud, such as was the case at point A in Fig. 11.05(a), this confirms that an uptrend is underway. This is a good point to enter into a long CFD trade.
For an exit level the trader then has several choices. He/she can exit the trade as soon as it drops below the red Tenkan Sen line at point C, which acts as primary point of support. A more adventurous trader could hang on until the trade breaks down through the second support level of the blue Kijun Sen at point D, but at this stage a lot of the profit in the trade would already have been lost.
Some traders even wait until the price drops back into the Ichimoku cloud again, but in the above example this would have meant giving up most of the profit the trade offered.
A similar approach is followed in a bear market: go short when the price drops below the cloud at point B; remain in the trade until it turns around and crosses the red Tenkan Sen line at point E (first resistance), or wait for it to cross the blue Kijun Sen at point F (second resistance). If the price turned around between points E and F this would have worked in the trader’s favour, but in this case it would have meant giving up much of the profit the trade offered.
Waiting until the trade entered the Ichimoku cloud again would have resulted in the trade barely breaking even or even making a loss.
The Ichimoku is actually a combination of different indicators that together form a formidable asset in many traders’ arsenals. With the help of this indicator it is possible to identify not only whether the market is in an up- or downtrend, but also where the vital support and resistance points can be found.
The indicator consists of five lines: The kijun-sen, tenkan-sen, senkou span A, senkou span B and chickou span. Fig. 11.05(a) is a candle stick price chart of the AUD/USD together with an Ichimoku Kinko Hyo chart
Fig. 11.05(a)
The Ichimoku Cloud is of paramount importance here. When the price is between the upper and lower levels of the cloud, i.e. inside the cloud, it is not recommended that the trader should enter into a new trade.
When the price breaks out from the top of the cloud, such as was the case at point A in Fig. 11.05(a), this confirms that an uptrend is underway. This is a good point to enter into a long CFD trade.
For an exit level the trader then has several choices. He/she can exit the trade as soon as it drops below the red Tenkan Sen line at point C, which acts as primary point of support. A more adventurous trader could hang on until the trade breaks down through the second support level of the blue Kijun Sen at point D, but at this stage a lot of the profit in the trade would already have been lost.
Some traders even wait until the price drops back into the Ichimoku cloud again, but in the above example this would have meant giving up most of the profit the trade offered.
A similar approach is followed in a bear market: go short when the price drops below the cloud at point B; remain in the trade until it turns around and crosses the red Tenkan Sen line at point E (first resistance), or wait for it to cross the blue Kijun Sen at point F (second resistance). If the price turned around between points E and F this would have worked in the trader’s favour, but in this case it would have meant giving up much of the profit the trade offered.
Waiting until the trade entered the Ichimoku cloud again would have resulted in the trade barely breaking even or even making a loss.
Author

Forex Crunch
Forex Crunch
More from Forex Crunch


