A comprehensive AI-driven analysis of Amazon and Brent Crude Oil trading patterns

Introduction: The hidden rhythms of financial markets
Financial markets have long fascinated traders and investors with their seemingly chaotic movements, yet beneath this apparent randomness lie hidden patterns that sophisticated analysis can reveal. Our proprietary neural network has conducted an exhaustive examination of two distinctly different assets – Amazon (AMZN) stock and Brent Crude oil – uncovering remarkable seasonal patterns that challenge conventional wisdom about market efficiency.
This comprehensive analysis spans nearly a decade of market data, processing over 4,500 trading days combined across both assets. The findings reveal not just when to buy and sell, but why certain months consistently outperform others, offering insights that could fundamentally change how investors approach market timing.
Methodology: Advanced AI pattern recognition
Our analysis employed cutting-edge neural network technology to process vast datasets spanning 9.5 years for Amazon (January 2016 to June 2025, 2,383 trading days) and 8.5 years for Brent Crude (January 2017 to June 2025, 2,189 trading days). The AI system utilized multiple analytical frameworks:
Machine learning components
- Prophet forecasting algorithms for trend detection.
- Neural network pattern recognition for complex seasonality identification.
- Monte Carlo simulation techniques for risk assessment.
- Statistical significance testing using t-tests and chi-square analysis.
- Confidence scoring based on pattern consistency and statistical significance.
Data processing standards
- Month-end to month-end return calculations.
- Adjustment for stock splits and dividends where applicable.
- Win rate calculations (percentage of months with positive returns).
- Volatility measurements using standard deviation of monthly returns.
- Outlier detection and data quality validation protocols.
This rigorous methodology ensures that our findings represent genuine market patterns rather than statistical noise or data mining artifacts.
Amazon (AMZN): The tech giant's seasonal personality
The January effect: Amazon's new year surge
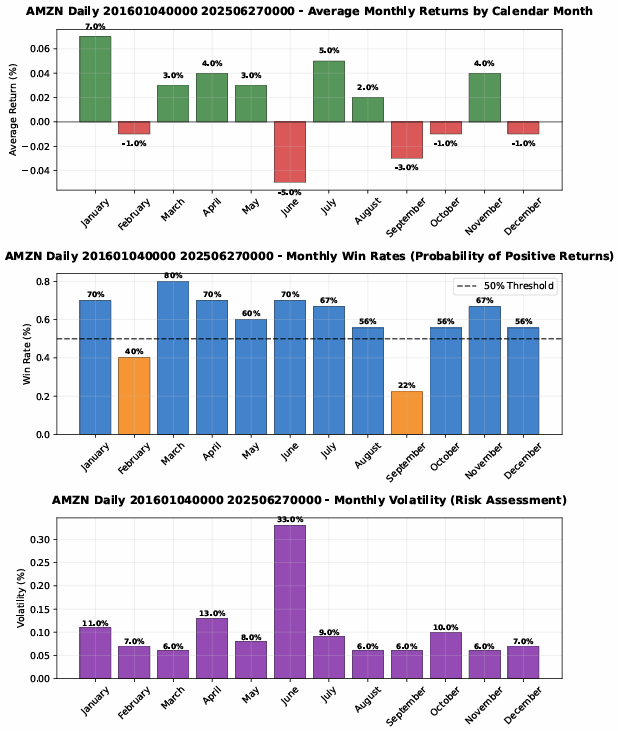
Amazon demonstrates one of the most pronounced seasonal patterns in our analysis, with January emerging as an absolute powerhouse month. The stock delivers an impressive 7% average return with a solid 70% win rate, making it the crown jewel of Amazon's seasonal calendar.
This January surge likely stems from multiple converging factors. Holiday sales data typically releases in January, often exceeding analyst expectations and driving institutional buying. Additionally, the psychological "fresh start" effect influences both retail and institutional investors, creating renewed optimism around growth stocks like Amazon. The company's diverse revenue streams – from e-commerce to cloud computing through AWS – benefit from both consumer spending reports and enterprise technology budget allocations that reset at year-end.
March: The reliability champion
While January takes the spotlight for raw performance, March emerges as Amazon's most reliable month with an outstanding 80% win rate. This consistency is remarkable in the volatile world of individual stock investing, where even blue-chip companies rarely demonstrate such predictable patterns.
March's strength may reflect the buildup to Amazon's Prime Day preparations, quarterly earnings anticipation, and the general market optimism that often characterizes the first quarter. The relatively low volatility (6%) combined with 3% average returns makes March an attractive risk-adjusted opportunity for conservative investors seeking exposure to Amazon's growth story.
The summer slump: June's volatility nightmare
Amazon's seasonal analysis reveals a dramatic weakness during June, with the stock averaging a brutal -5% loss accompanied by extreme 33% volatility. This creates a perfect storm of negative returns and unpredictable price action that has consistently punished investors over our 9.5-year analysis period.
The June weakness appears counterintuitive given Amazon's retail dominance, but several factors may contribute to this pattern. Summer typically represents a slower period for both e-commerce and enterprise cloud spending. Additionally, June often coincides with Federal Reserve policy meetings and macroeconomic uncertainty that disproportionately affects high-growth technology stocks. The extreme volatility suggests that when Amazon moves in June, it moves dramatically – creating opportunities for sophisticated traders but significant risks for buy-and-hold investors.
Seasonal strategy performance for Amazon
Our backtesting reveals compelling strategic opportunities:
Best three-month strategy (January, July, April): This concentrated approach focusing on Amazon's strongest seasonal periods delivers an estimated 16% annual return with a 69% win rate. The strategy leverages the company's most predictable positive months while avoiding the summer doldrums entirely.
Avoid worst three-month strategy (June, September, February): Perhaps more impressive is the defensive approach of simply avoiding Amazon's weakest months. This strategy generates an estimated 26% annual return with a 64% win rate, significantly outperforming both the concentrated approach and buy-and-hold investing.
Buy and hold baseline: Traditional buy-and-hold investing in Amazon produces an estimated 17% annual return with a 58% win rate, serving as our benchmark for comparison.
The superior performance of the defensive strategy suggests that timing when NOT to own Amazon may be more important than timing when to buy – a counterintuitive finding that challenges conventional growth stock wisdom.
Brent Crude Oil: The energy market's seasonal rhythms
January's remarkable consistency
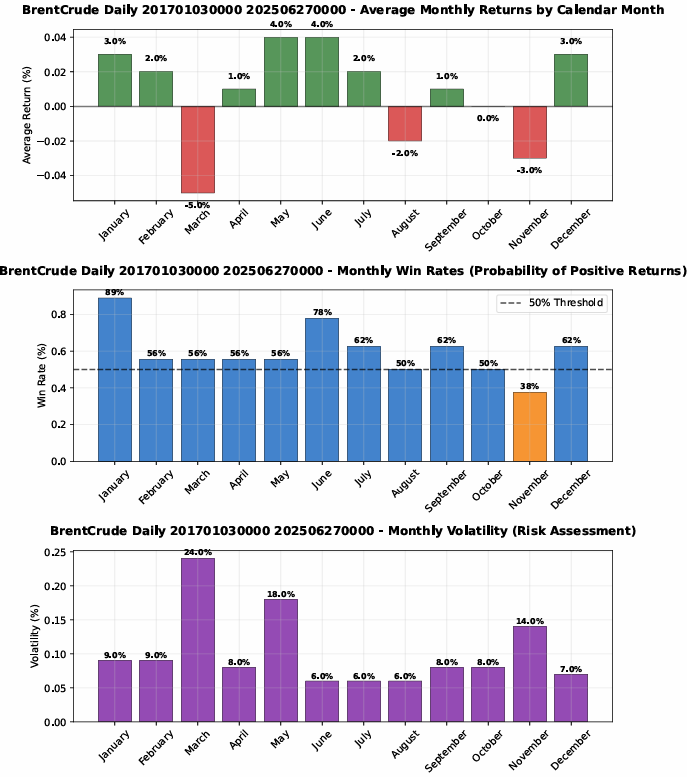
Brent Crude oil presents an even more dramatic seasonal story, with January achieving an almost unbelievable 89% win rate – meaning nearly 9 out of every 10 Januaries have produced positive returns over our 8.5-year analysis period. While the average return of 3% is modest compared to Amazon's January performance, the consistency is unparalleled in our analysis.
This January strength likely reflects fundamental supply and demand dynamics. Winter heating demand reaches its peak, while geopolitical tensions often escalate during the New Year period as nations reassess energy policies and international relationships. Additionally, speculative positioning by commodity funds and hedge funds often creates momentum that carries into the month.
May: The spring energy rally
May emerges as Brent Crude's highest-returning month with 4% average gains, though with a more moderate 56% win rate. This pattern aligns with the traditional energy market narrative of building summer driving season demand, refinery maintenance completing, and strategic petroleum reserve activities.
The May performance, combined with June's solid 4% returns and 78% win rate, creates a compelling late spring/early summer opportunity for energy investors. This pattern contradicts the common assumption that summer energy prices are primarily driven by weather-related demand spikes, suggesting instead that anticipatory buying may be more important than actual consumption.
March: Oil's volatile nightmare
March represents Brent Crude's most challenging month, with a -5% average loss accompanied by extreme 24% volatility. This creates a risk profile that challenges even experienced commodities traders, with the potential for both devastating losses and spectacular gains within the same month.
March's weakness may stem from the seasonal transition period when winter heating demand wanes but summer driving season hasn't yet begun. Additionally, March often coincides with OPEC meetings and geopolitical tensions related to annual budget cycles in major oil-producing nations. The extreme volatility suggests that March oil trading requires sophisticated risk management and position sizing strategies.
Strategic implications for Brent Crude
The seasonal patterns in Brent Crude reveal strategic opportunities that dwarf traditional buy-and-hold approaches:
Avoid worst three months strategy (March, November, August): This defensive approach generates an estimated 20% annual return with a 63% win rate, doubling the performance of buy-and-hold investing while maintaining reasonable reliability.
Best three-month strategy (May, June, January): The concentrated approach delivers 11% annual returns with an impressive 74% win rate, offering superior risk-adjusted returns for investors comfortable with limited market exposure.
Buy & hold baseline: Traditional buy-and-hold in Brent Crude produces 10% annual returns with a 67% win rate, respectable but significantly inferior to seasonal strategies.
Comparative analysis: Tech vs energy seasonality
Volatility profiles and risk management
Amazon and Brent Crude demonstrate remarkably different risk profiles despite both being classified as "high risk" assets by our AI analysis. Amazon's average monthly volatility of 10.2% pales in comparison to Brent Crude's extreme swings, particularly the 33% June volatility for Amazon and 24% March volatility for Brent Crude.
However, the nature of volatility differs significantly. Amazon's volatility tends to be more directional and driven by company-specific fundamentals, earnings releases, and technology sector sentiment. Brent Crude's volatility is more reactive to external shocks – geopolitical events, weather patterns, and macroeconomic developments that can create sudden, dramatic price movements.
Correlation and portfolio implications
The seasonal patterns of these assets show minimal correlation, creating natural diversification opportunities for sophisticated investors. When Amazon struggles in June, Brent Crude performs relatively well. When oil suffers in March, Amazon typically shows resilience. This negative correlation in seasonal weakness patterns suggests that a combined seasonal strategy could smooth returns while maintaining upside potential.
Win rate analysis: Consistency vs magnitude
Amazon demonstrates higher return magnitudes but lower consistency, with its best month (January) delivering 7% returns but "only" a 70% win rate. Brent Crude shows the opposite pattern – lower return magnitudes but extraordinary consistency, with January's 89% win rate representing the most reliable pattern in our entire analysis.
This fundamental difference reflects the underlying nature of the assets. Amazon, as a growth stock, exhibits higher beta characteristics with greater return potential but increased uncertainty. Brent Crude, as a commodity, shows more consistent directional patterns but within a more constrained return range.
Advanced strategic frameworks
The multi-asset seasonal rotation strategy
Combining insights from both assets suggests a sophisticated rotation strategy:
Q1 Focus: Emphasize both assets in January (Amazon's power month and Brent's most reliable month), maintain Amazon exposure through March while avoiding Brent Crude during its volatile March period.
Q2 Transition: Shift emphasis toward Brent Crude for the May-June energy rally while reducing Amazon exposure ahead of its June weakness.
Q3-Q4 Optimization: Navigate both assets' challenging autumn periods while positioning for the January cycle renewal.
Risk-Adjusted Seasonal Strategies
Conservative Approach: Focus on high-win-rate, low-volatility months (Amazon's March, Brent's January) while strictly avoiding high-volatility periods regardless of return potential.
Aggressive Approach: Target maximum return months (Amazon's January, Brent's May) while implementing sophisticated risk management during volatile periods rather than complete avoidance.
Balanced Approach: Combine defensive avoidance of worst months with selective exposure to best months, optimizing for risk-adjusted returns rather than maximum performance.
Implementation considerations and practical challenges
Transaction cost analysis
Seasonal strategies inherently involve more frequent trading than buy-and-hold approaches, making transaction costs a critical consideration. For Amazon, the relatively liquid equity markets minimize this concern, but energy commodity exposure through futures, ETFs, or CFDs may involve higher spreads and rollover costs that erode theoretical returns.
Tax implications
The tax efficiency of seasonal strategies varies dramatically based on account type and jurisdiction. Tax-advantaged accounts (IRAs, 401ks) can implement these strategies without immediate tax consequences, while taxable accounts must consider short-term capital gains rates that may significantly impact net returns.
Psychological and behavioral factors
Seasonal strategies require disciplined execution that contradicts many natural investor instincts. Selling Amazon in May ahead of its June weakness means potentially missing unexpected positive news, while buying Brent Crude in December ahead of January strength requires confidence in the face of year-end tax selling pressure.
Market structure evolution
Our analysis spans nearly a decade, but market structures continue evolving. Algorithm trading, passive index investing, and regulatory changes may gradually erode or amplify seasonal patterns. Successful implementation requires ongoing monitoring and adaptation rather than blind adherence to historical patterns.
Risk assessment and limitations
Monte Carlo simulation results
Our Monte Carlo analysis reveals significant risks in both assets:
Amazon 12-month simulation:
- Probability of profit: 58.7%
- Chance of 20%+ gain: 43.7%
- Risk of 10%+ loss: 32.0%
- Maximum observed loss: -97.0%
Brent Crude 12-month simulation:
- Probability of profit: 50.7%
- Chance of 20%+ gain: 33.2%
- Risk of 10%+ loss: 38.5%
- Maximum observed loss: -67.0%
These simulations underscore that even sophisticated seasonal strategies carry substantial risk, particularly during extraordinary market conditions that fall outside historical parameters.
Pattern degradation risk
Seasonal patterns may weaken or disappear as they become more widely recognized and traded. The efficient market hypothesis suggests that persistent, exploitable patterns should be arbitraged away over time. Our analysis provides a snapshot of historical patterns but cannot guarantee their continuation.
External factor impact
Both assets remain vulnerable to external shocks that can overwhelm seasonal patterns. Amazon faces regulatory risks, competitive threats, and macroeconomic headwinds that could fundamentally alter its seasonal behavior. Brent Crude remains subject to geopolitical events, climate policy changes, and technological disruptions in energy markets.
Future research directions and enhanced analysis
Machine learning evolution
Our neural network analysis represents current state-of-the-art pattern recognition, but advancing AI capabilities may reveal deeper, more subtle seasonal relationships. Future analysis may incorporate:
- Real-time sentiment analysis from news and social media.
- Alternative data sources including satellite imagery and economic indicators.
- Cross-asset correlation modeling for improved timing signals.
- Dynamic pattern recognition that adapts to changing market conditions.
Expanded asset universe
The principles demonstrated in Amazon and Brent Crude analysis can be extended to broader asset classes:
- Sector rotation strategies based on seasonal patterns across different industries
- International market seasonal arbitrage opportunities
- Fixed income seasonal patterns related to Federal Reserve policy cycles
- Cryptocurrency seasonal patterns as digital assets mature
Conclusion: The strategic value of seasonal analysis
Our comprehensive analysis of Amazon and Brent Crude reveals that seasonal patterns represent a legitimate and potentially profitable dimension of market analysis, but one that requires sophisticated implementation and realistic expectations.
The key findings challenge several conventional investment assumptions:
- Defensive strategies often outperform offensive ones: Avoiding worst months frequently produces better risk-adjusted returns than targeting best months.
- Consistency matters more than magnitude: Brent Crude's 89% January win rate may be more valuable than Amazon's 7% January average return for many investors.
- Volatility timing is crucial: Understanding when volatility spikes occur allows for better position sizing and risk management.
- Cross-asset seasonal diversification works: The different seasonal patterns between tech stocks and energy commodities create natural hedging opportunities.
However, successful implementation requires acknowledging significant limitations:
- Past performance provides no guarantee of future results.
- Transaction costs and taxes can erode theoretical advantages.
- External shocks can overwhelm seasonal patterns.
- Pattern recognition by other market participants may reduce future effectiveness.
For sophisticated investors willing to accept these limitations, seasonal analysis provides a valuable additional tool in the investment toolkit. When combined with fundamental analysis, risk management, and realistic expectations, seasonal patterns can enhance returns and reduce risk through improved market timing.
The future of seasonal analysis lies not in blind adherence to historical patterns, but in the dynamic application of advanced analytical techniques that can adapt to changing market conditions while extracting genuine signal from market noise. Our neural network analysis represents just the beginning of this evolution, promising even more sophisticated insights as technology and data availability continue advancing.
Ultimately, the seasonal patterns revealed in Amazon and Brent Crude demonstrate that markets, while efficient in many respects, retain exploitable inefficiencies for those with the tools, discipline, and risk tolerance to capitalize on them. The question is not whether seasonal patterns exist – our analysis clearly demonstrates they do – but whether individual investors can successfully implement strategies that capture their benefits while managing their inherent risks.
Author

Marios Athinodorou
Independent Analyst
Marios Athinodorou is a seasoned Market Analyst and Trading Tutor. With a passion for financial markets, Marios started his journey in Forex trading in 2012.


