Get Informed
I want to expand this idea and take a look at the different market types we generally find. No market is trending or ranging permanently, price action always moves through different conditions and even within a trending phase or a ranging phase the price action can vary greatly. Understanding the conditions that suit your strategy best and the conditions that cause your strategy problems is an important learning curve in trading and begins with first learning to understand the different market types present.
The Different Market Types
Classifying the various market types we see is an idea that features prominently in the work of eminent trading psychologist and coach Dr. Van Tharp. Although his work is particularly detailed and features around 25 distinct market types the main market types to understand and learn to identify are as follows:
Bull Normal
Bull normal is an upward moving market that has steady momentum behind it and is generally bought on dips, with price action displaying the typical “staircase” pattern that we get when we see higher highs, higher lows, higher highs etc. This market is characterized by steady advances to the upside, followed by brief retracements and consolidation before further upside manifests.
Bull Volatile
Bull volatile is an upward moving market that has rapidly accelerating momentum behind it and features large bullish candles. This market is characterized by its explosive movement offering very little retracement and only particularly brief pauses which only register on the lower time-frames.
Bear Normal
Bear normal is a downward moving market that has steady momentum behind it and is generally sold on rallies, with price action displaying the typical “down the stairs” pattern that we get when we see lower lows, lower highs, lower lows. This market is characterised by steady advances to the downside followed by brief retracement higher and consolidation before further downside manifests.
Bear Volatile
Bear volatile is a downward moving market that has rapidly accelerating momentum behind it and features large bearish candles. This market is characterized by its explosive movement offering very little retracement and only particularly brief pauses which only register on the lower time-frames.
Sideways Quiet
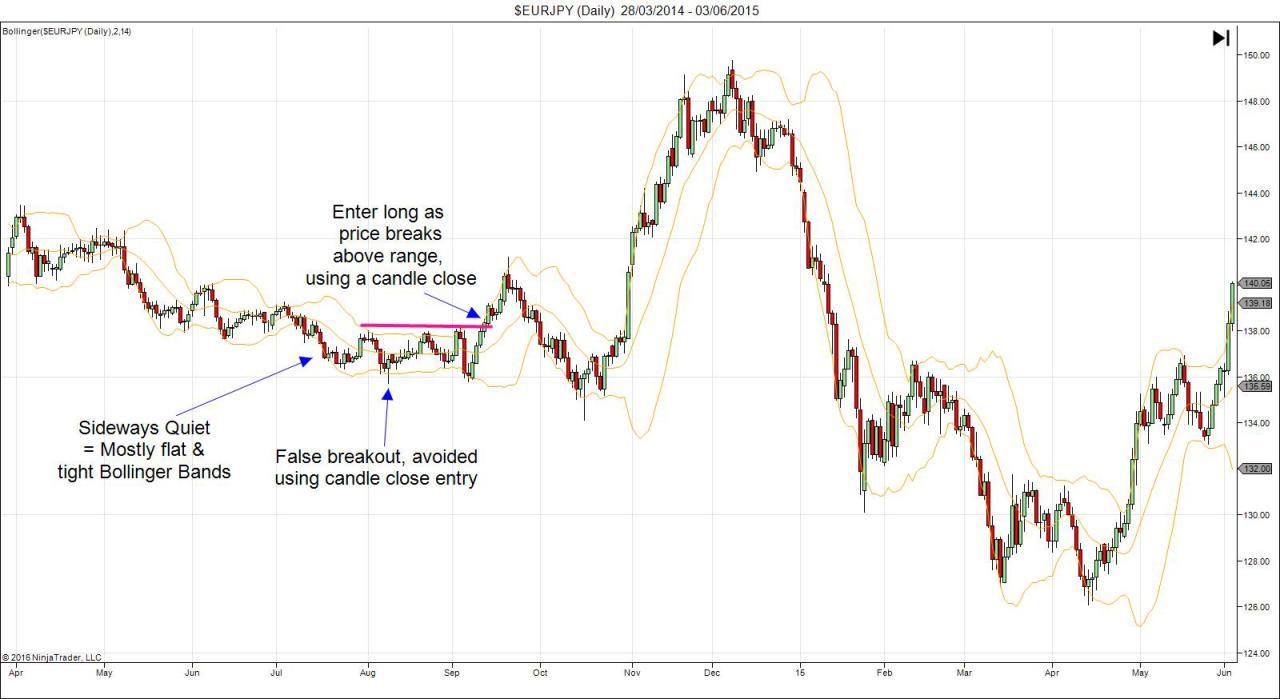
Sideways quiet is a ranging market which is very low volume and generally direction-less though sometimes features a very slight bullish or bearish drift. This market is characterised by its very shallow and choppy trading range and is generally comprised of many short candles indicating the lack of movement per session.
Sideways Volatile
Sideways volatile is a ranging market which is much higher volume and though generally direction-less, can also feature a slight bullish or bearish drift. This market is characterized by its very large rotations between areas of resistance and support. As with sideways quiet, the range is lacking in direction but is of a much larger scale due to the volume behind the moves.
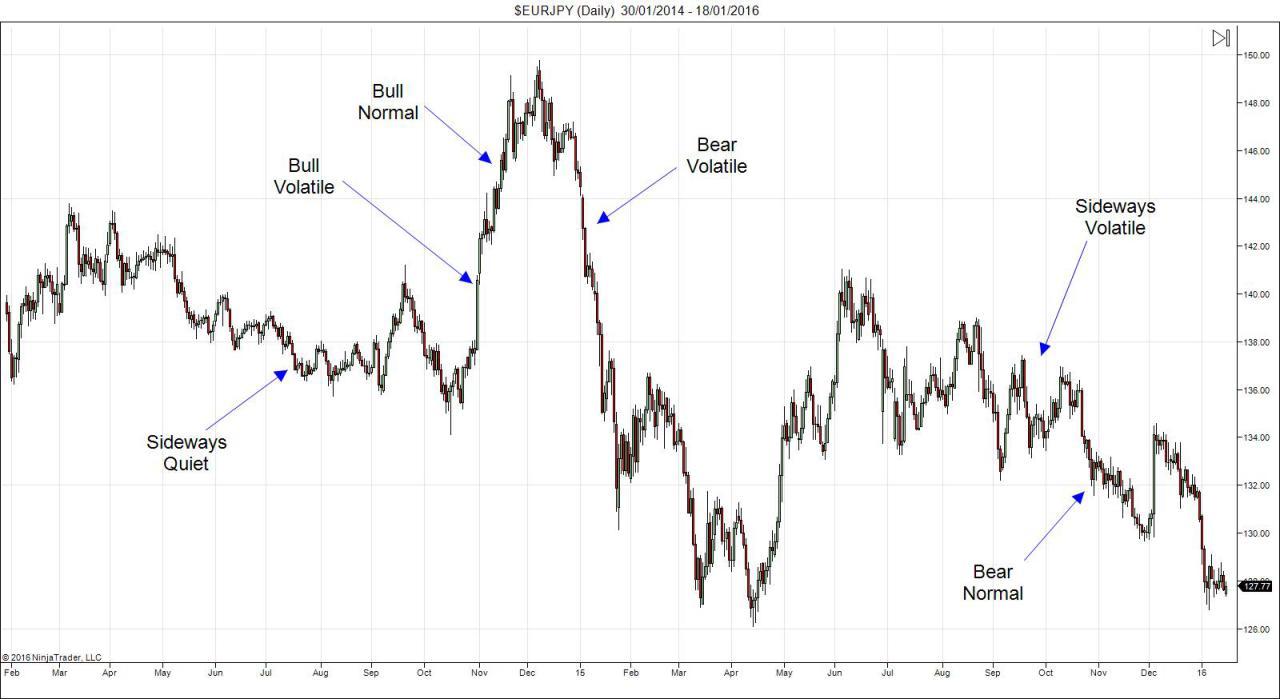
In the chart above you can see an example of each of these different market types. Let’s take a look more closely at how we define and identify each individual type.
Top Tip For Identifying Different Market Types
Once you’ve put in enough screen time you should become pretty good at identifying the different market types, although there will always be times when it is difficult to clarify conditions. However, one tool that you can use immediately to really help you in classifying the market is the Bollinger Bands indicator. The information given on both direction and volatility make this indicator highly effective in this task.
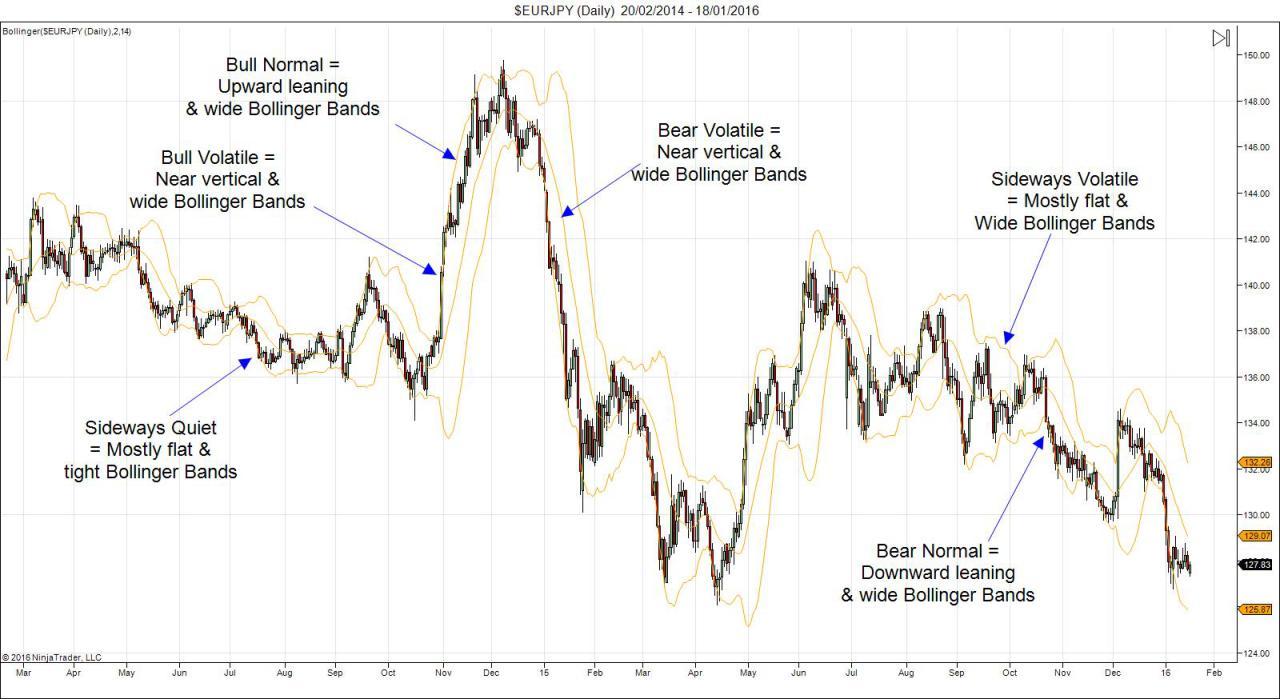
In the example above we can see the same chart but with Bollinger Bands applied. Notice how the Bollinger Bands perfectly represent the various market types and make it much easier to pick them out? This is a great time-saving tool to use and can really help build your ability to identify different market types.
So there you have it, the six main market types that generally define the various states you will find. Now you know the market types present, you need to know what to do with them.
Using Market Types To Your Advantage
As we mentioned earlier, knowing the conditions that best suit your strategy and the conditions that challenge it most, is an important step to success because if you can become adept at maximising the opportunity when conditions are favourable and scaling back risk when conditions are adverse, you can really enhance your returns. To effectively operate in this manner it is important to understand the strategy types that work best in different market conditions.
1.Bull Normal
When market is trending upward and displaying frequent retracements we want to look to buy on dips back into key support or buy on breakouts above recent highs. Generally works best on lower time frames. So where we establish a daily Bull Normal market we can drop down on to the Hourly and look to buy dips or breakouts. Stops need to be kept wide enough to allow for retracements and especially on buying breakouts, traders should avoid moving to break even until the breakout zone has been tested as this is a common mistake many traders make and means them getting shaken out just before price takes off. In these conditions we shouldn’t be looking to fade resistance as it is a low probability trade, against the trend.
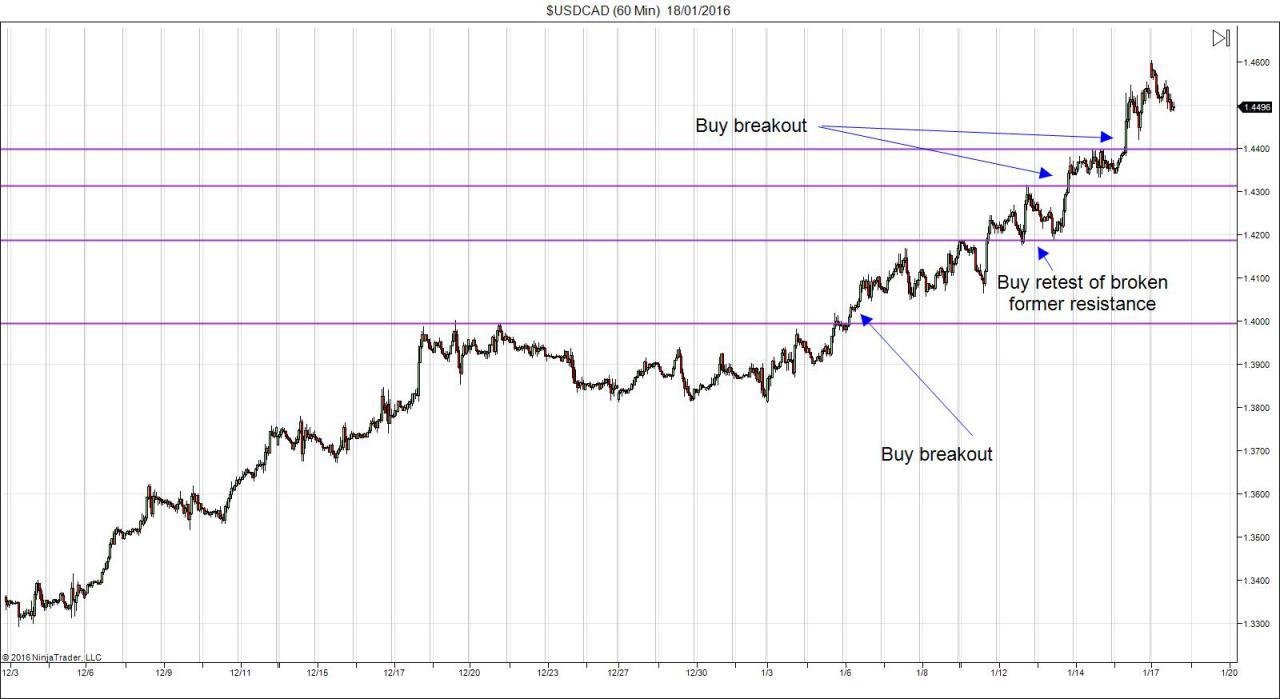
2.Bull Volatile
Bull volatile can be a tricky market to gain entry to as generally retracement are few and far between and price tends not to test broken former resistance. In these conditions we are best to play simple breakouts with a tight stop, looking to catch the momentum. Again use lower time-frames to highlight resistance areas and enter as price breaks through. Attempting to fade these moves is extremely high risk and should be avoided.
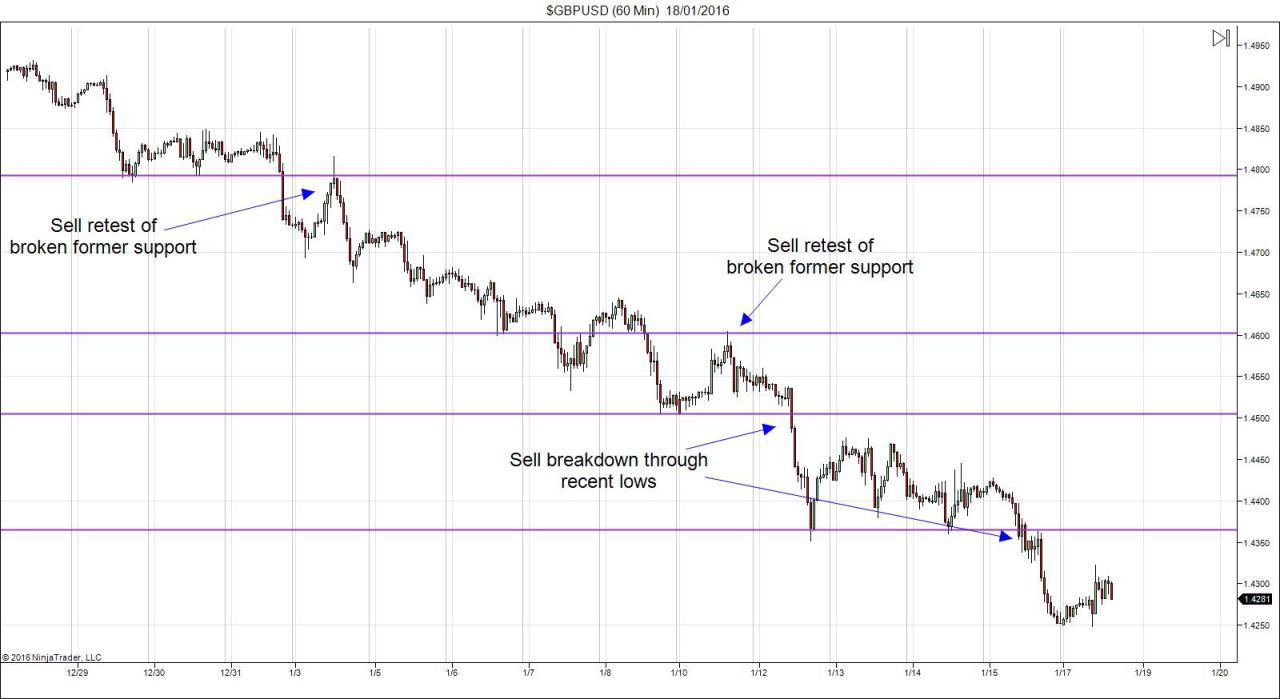
3.Bear Normal
When market is trending downward and displaying frequent retracements we want to look to sell on rallies into key resistance or sell on break downs below recent lows.. Generally works best on lower time frames. So where we establish a daily Bear Normal market we can drop down on to the Hourly and look to sell rallies or break-downs. Stops need to be kept wide enough to allow for retracements and especially on selling breakdowns, traders should avoid moving to break even until the breakout zone has been tested as this is a common mistake many traders make and means them getting shaken out just before price takes off In these conditions we shouldn’t be looking to fade support as it is a low probability trade, against the trend.

4.Bear Volatile
Bear Volatile can be a tricky market to gain entry to as generally retracements are few and far between and price tends not to test broken former support. In these conditions we are best to play simple breakdown strategies with a tight stop, looking to catch momentum. Again use lower time-frames to highlight support areas and enter as price breaks through. Attempting to fade these moves is extremely high risk and should be avoided.
5.Sideways Quiet
Sideways Quiet is a particularly boring and low opportunity market as the lack of momentum means the range is very shallow and so even a typical range-reversal strategy, whereby we look to fade support and resistance, tends to be low yielding as there is simply not enough movement to profit from. When conditions are like this, it is best to allow the range to develop and mature and wait to play the breakout. Beware false breakouts though as these can be quite common in these conditions and so only trade candle closes as these give more weight to the breakout.
6.Sideways Volatile
Sideways Volatile can be a really profitable market for those who know how to trade it correctly. With price essentially just rotating back and forth between support and resistance areas there is ample opportunity to operate a range-reversal strategy and, unlike sideways quiet, because the range is much wider due to higher volume there is worthy profit on the table.between support and resistance areas. As volume is higher in these conditions and momentum is built up, stops need to be wide enough to cope with price breaking support and resistance as often in these conditions we see exhaustion in these areas where price spikes through only to then reverse sharply.
Task
Pull up a chart and try to identify the various market types we’ve discussed. If you can do it without the use of Bollinger bands that’s great but if you need to use Bollinger Bands then no problem . Spend some time looking over different charts and highlighting examples then look to some recent price action across various charts and note down which market type you think price is in and how you expect it to react based on your analysis.
You might be surprised at how quickly you become adept at accurately identifying the various market types and anticipating how price will behave. From there you have a solid foundation to start building trading ideas and exploiting opportunities. Remember, as with all trading strategies and methods it always pays to wait for the clearest setups. If you are struggling to identify a market type, simply move onto another chart. There will be times when markets are transitioning between different types and it can be hard to identify trading conditions. Simply wait until the conditions become clear and in the meantime look elsewhere for charts which are clearly displaying a particular market type and offer cleaner opportunities.
This market forecast is for general information only. It is not an investment advice or a solution to buy or sell securities.
Authors' opinions do not represent the ones of Orbex and its associates. Terms and Conditions and the Privacy Policy apply.
Trading foreign exchange on margin carries a high level of risk, and may not be suitable for all investors. Before deciding to trade foreign exchange, you should carefully consider your investment objectives, level of experience, and risk appetite. There is a possibility that you may sustain a loss of some or all of your investment and therefore you should not invest money that you cannot afford to lose. You should be aware of all the risks associated with foreign exchange trading, and seek advice from an independent financial advisor if you have any doubts.
Editors’ Picks

EUR/USD: US Dollar to remain pressured until uncertainty fog dissipates
Unimpressive European Central Bank left monetary policy unchanged for the fifth consecutive meeting. The United States first-tier employment and inflation data is scheduled for the second week of February. EUR/USD battles to remain afloat above 1.1800, sellers moving to the sidelines.

GBP/USD reclaims 1.3600 and above
GBP/USD reverses two straight days of losses, surpassing the key 1.3600 yardstick on Friday. Cable’s rebound comes as the Greenback slips away from two-week highs in response to some profit-taking mood and speculation of Fed rate cuts. In addition, hawkish comments from the BoE’s Pill are also collaborating with the quid’s improvement.

USD/JPY gathers strength to near 157.50 as Takaichi’s party wins snap elections
The USD/JPY pair attracts some buyers to around 157.45 during the early Asian session on Monday. The Japanese Yen weakens against the US Dollar after Japan’s ruling Liberal Democratic Party won an outright majority in Sunday’s lower house election, opening the door to more fiscal stimulus by Prime Minister Sanae Takaichi.
Editors’ Picks
USD/JPY gathers strength to near 157.50 as Takaichi’s party wins snap elections
The USD/JPY pair attracts some buyers to around 157.45 during the early Asian session on Monday. The Japanese Yen weakens against the US Dollar after Japan’s ruling Liberal Democratic Party won an outright majority in Sunday’s lower house election, opening the door to more fiscal stimulus by Prime Minister Sanae Takaichi.
EUR/USD: US Dollar to remain pressured until uncertainty fog dissipates
Unimpressive European Central Bank left monetary policy unchanged for the fifth consecutive meeting. The United States first-tier employment and inflation data is scheduled for the second week of February. EUR/USD battles to remain afloat above 1.1800, sellers moving to the sidelines.

Gold: Volatility persists in commodity space
After losing more than 8% to end the previous week, Gold remained under heavy selling pressure on Monday and dropped toward $4,400. Although XAU/USD staged a decisive rebound afterward, it failed to stabilize above $5,000. The US economic calendar will feature Nonfarm Payrolls and Consumer Price Index data for January, which could influence the market pricing of the Federal Reserve’s policy outlook and impact Gold’s performance.

Week ahead: US NFP and CPI data to shake Fed cut bets, Japan election looms
US NFP and CPI data awaited after Warsh’s nomination as Fed chief. Yen traders lock gaze on Sunday’s snap election. UK and Eurozone Q4 GDP data also on the agenda. China CPI and PPI could reveal more weakness in domestic demand.

Three scenarios for Japanese Yen ahead of snap election Premium
The latest polls point to a dominant win for the ruling bloc at the upcoming Japanese snap election. The larger Sanae Takaichi’s mandate, the more investors fear faster implementation of tax cuts and spending plans.
RECOMMENDED LESSONS
Making money in forex is easy if you know how the bankers trade!
I’m often mystified in my educational forex articles why so many traders struggle to make consistent money out of forex trading. The answer has more to do with what they don’t know than what they do know. After working in investment banks for 20 years many of which were as a Chief trader its second knowledge how to extract cash out of the market.
5 Forex News Events You Need To Know
In the fast moving world of currency markets where huge moves can seemingly come from nowhere, it is extremely important for new traders to learn about the various economic indicators and forex news events and releases that shape the markets. Indeed, quickly getting a handle on which data to look out for, what it means, and how to trade it can see new traders quickly become far more profitable and sets up the road to long term success.
Top 10 Chart Patterns Every Trader Should Know
Chart patterns are one of the most effective trading tools for a trader. They are pure price-action, and form on the basis of underlying buying and selling pressure. Chart patterns have a proven track-record, and traders use them to identify continuation or reversal signals, to open positions and identify price targets.
7 Ways to Avoid Forex Scams
The forex industry is recently seeing more and more scams. Here are 7 ways to avoid losing your money in such scams: Forex scams are becoming frequent. Michael Greenberg reports on luxurious expenses, including a submarine bought from the money taken from forex traders. Here’s another report of a forex fraud. So, how can we avoid falling in such forex scams?
What Are the 10 Fatal Mistakes Traders Make
Trading is exciting. Trading is hard. Trading is extremely hard. Some say that it takes more than 10,000 hours to master. Others believe that trading is the way to quick riches. They might be both wrong. What is important to know that no matter how experienced you are, mistakes will be part of the trading process.
The challenge: Timing the market and trader psychology
Successful trading often comes down to timing – entering and exiting trades at the right moments. Yet timing the market is notoriously difficult, largely because human psychology can derail even the best plans. Two powerful emotions in particular – fear and greed – tend to drive trading decisions off course.