Trading the pennant and flag pattern

According to Thomas Bulkowski, one of the most profitable technical patterns is the high and tight flag, breaking higher. According to Bulkowski, when properly recognised, it can reach a target up to 90% of the time. So, here is what you need to look for to recognise them.
Recognising the flag pattern
Here are the steps to recognising the pattern:
-
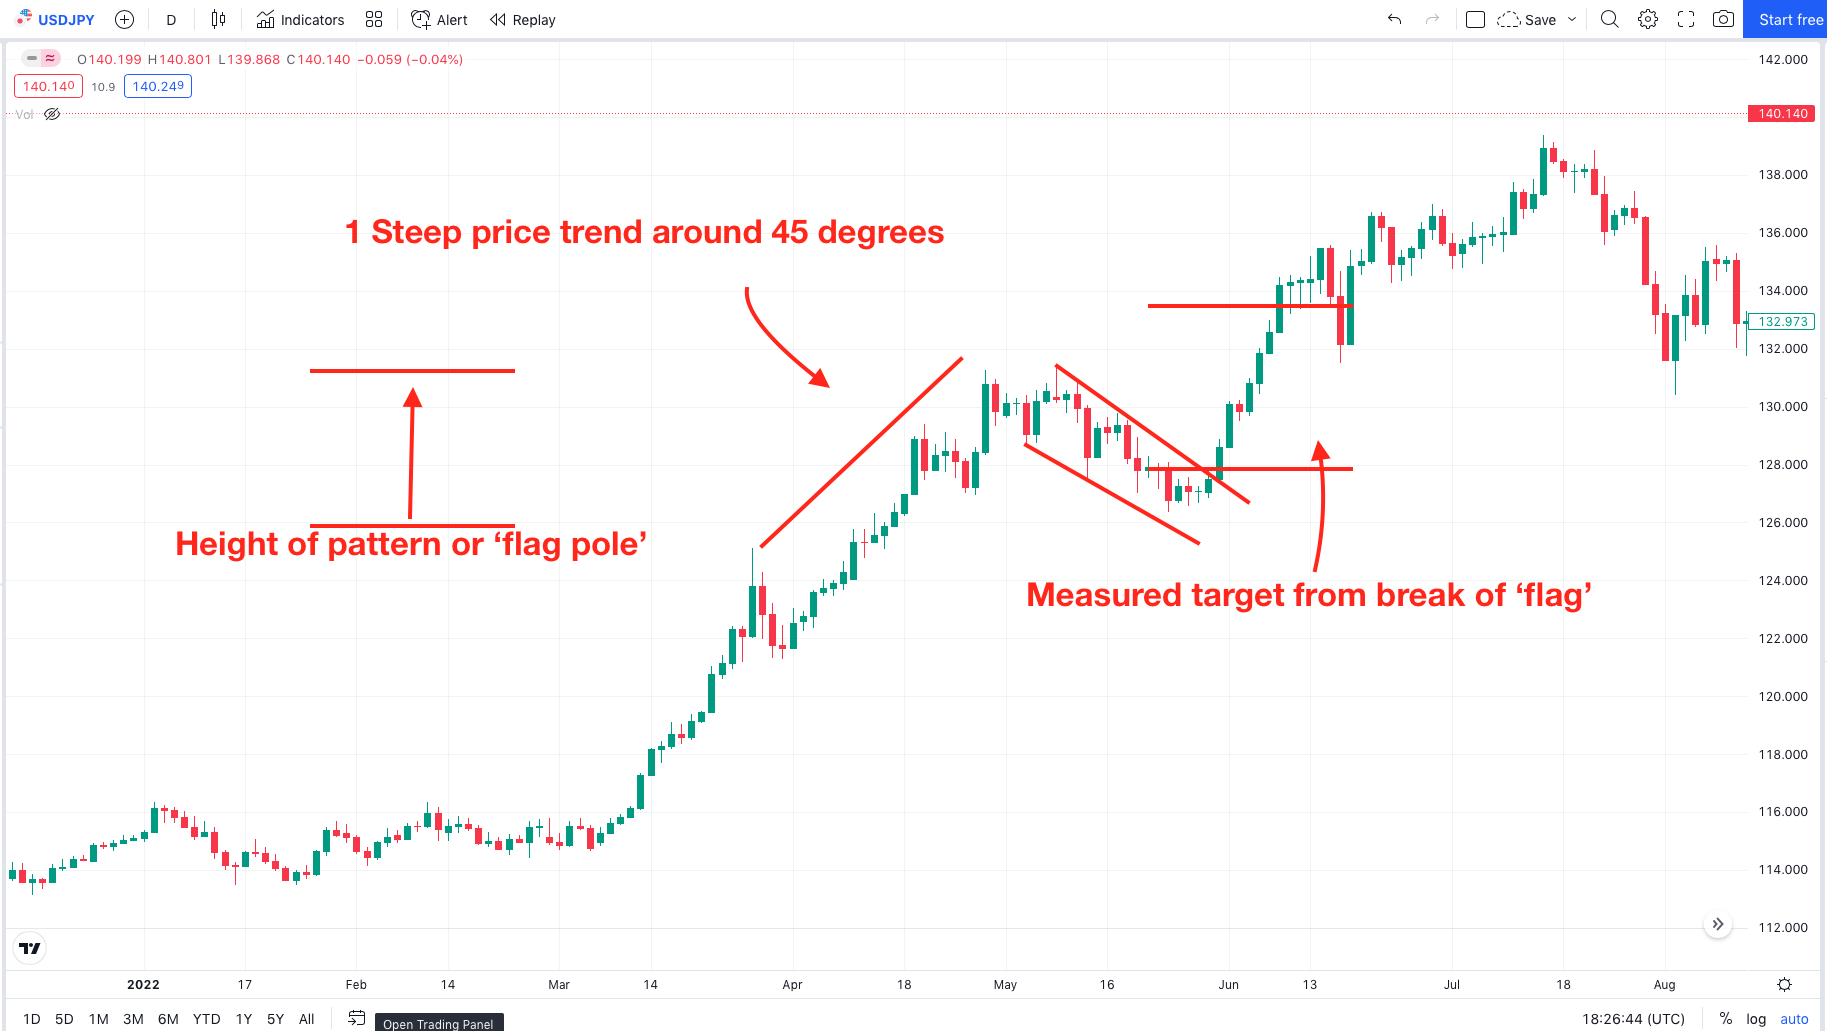
First of all, you need to witness a steep and sharp price trend (ideally over 90% gain).
-
Ideally, this price move should be around 45 degrees.
-
Then you need to see the price from a small channel that resembles a ‘flag’ pattern.
-
The best performance comes when the flag slopes away from the preceding trend.
-
Flag formations should form over a few short days – ideally, less than 15 days.
-
Use the measured rule to aim for your target. So, the height of the move preceding the ‘flag’ formation is the measured target from the breakout of the pattern.
-
Use a trailing stop to lock in profits.
-
The trade entry is simply the break of the pattern and stops can be placed on the other side of the pattern.
Here is a look at what the Flag pattern should look like:
The logic
The most likely reason the flag pattern works is that by definition you are already entering a trending market. That is a prerequisite for finding the pattern. This pushes the odds in your favor and, when combined with a trailing stop, you can see why some traders focus on trading the flag and pennant pattern in isolation.
Author

Giles Coghlan LLB, Lth, MA
Financial Source
Giles is the chief market analyst for Financial Source. His goal is to help you find simple, high-conviction fundamental trade opportunities. He has regular media presentations being featured in National and International Press.


