Trading Breakouts in Forex

When trading Forex, one can either choose to follow the myriad rules that other traders have put in place or go their own way. The path chosen will depend on several factors, such as experience, technical knowledge and risk appetite. As the saying goes, smooth seas never made a skilled sailor - and the same can be said for traders.
While everyone is free to forget their own path to becoming a successful trader, others may prefer to adopt a tried-and-tested strategy that has helped many traders before them. One of these strategies is based on breakout situations – how to prepare for them, how to spot them and how to react, quickly.
What are Breakouts in Forex?
Put simply, a breakout is a sudden sharp movement in the price of an asset, which moves away from the established support and resistance areas. A rise in price indicates a bullish breakout trend, whereas a decrease in price indicates a bearish market.
Think back to the first time you tried to interpret a chart and you most likely felt it was impossible to draw patterns between price movements. While markets can be highly unpredictable, breakout patterns can help a trader see the charts in a whole new light. Once breakouts start to be identified, a trader begins to view the marketplace as one large puzzle, waiting to be solved.
Types of Breakouts
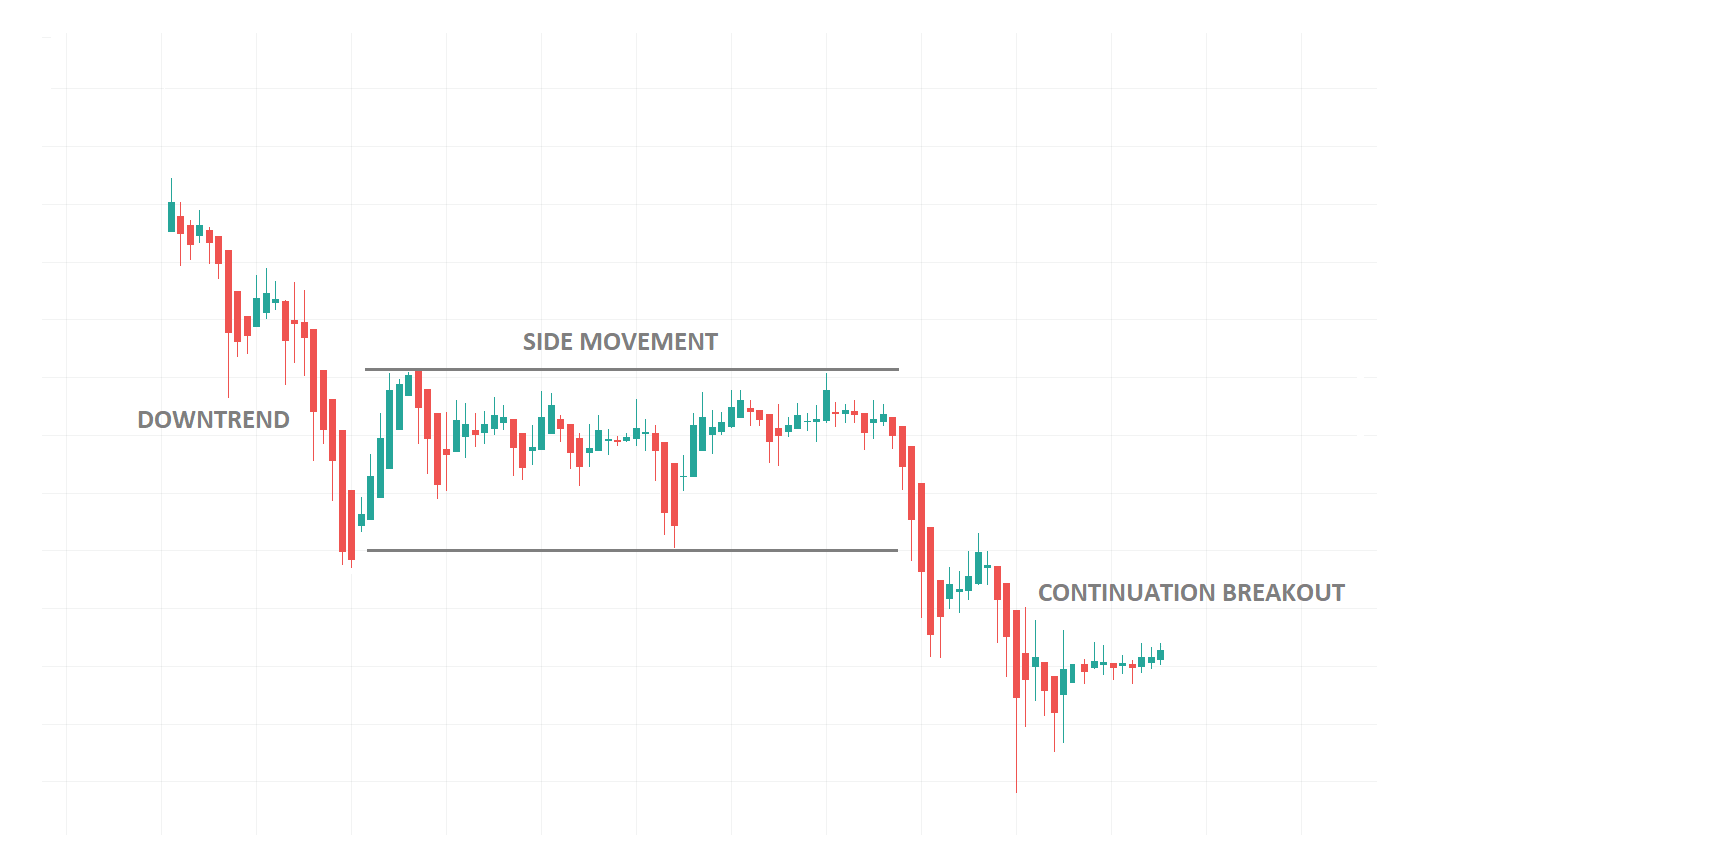
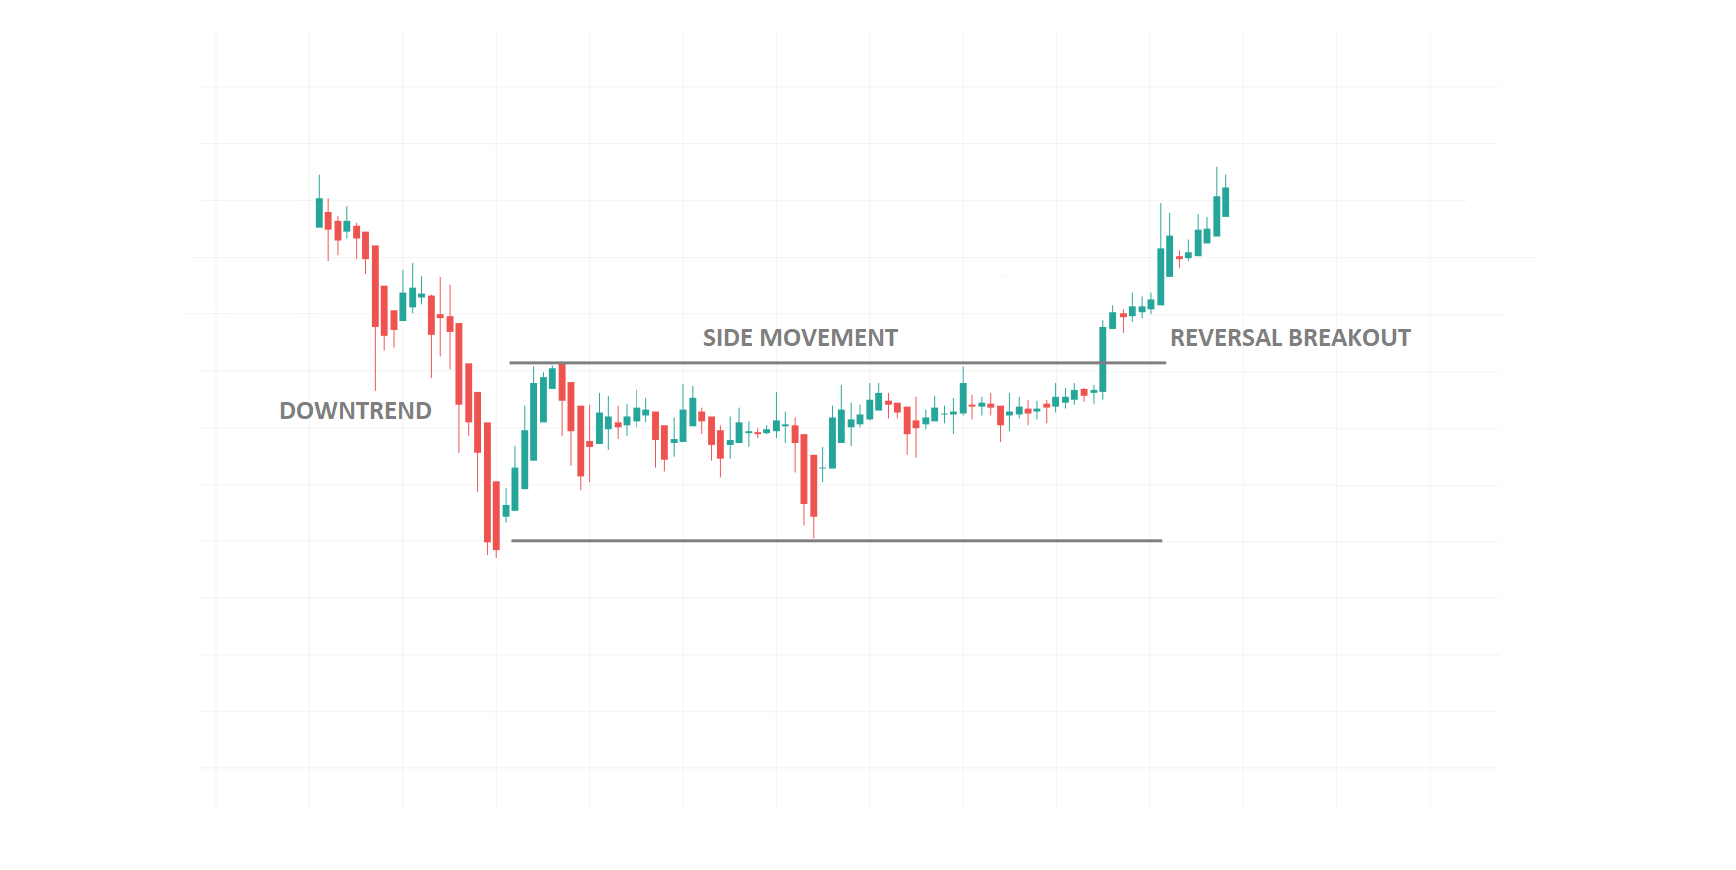
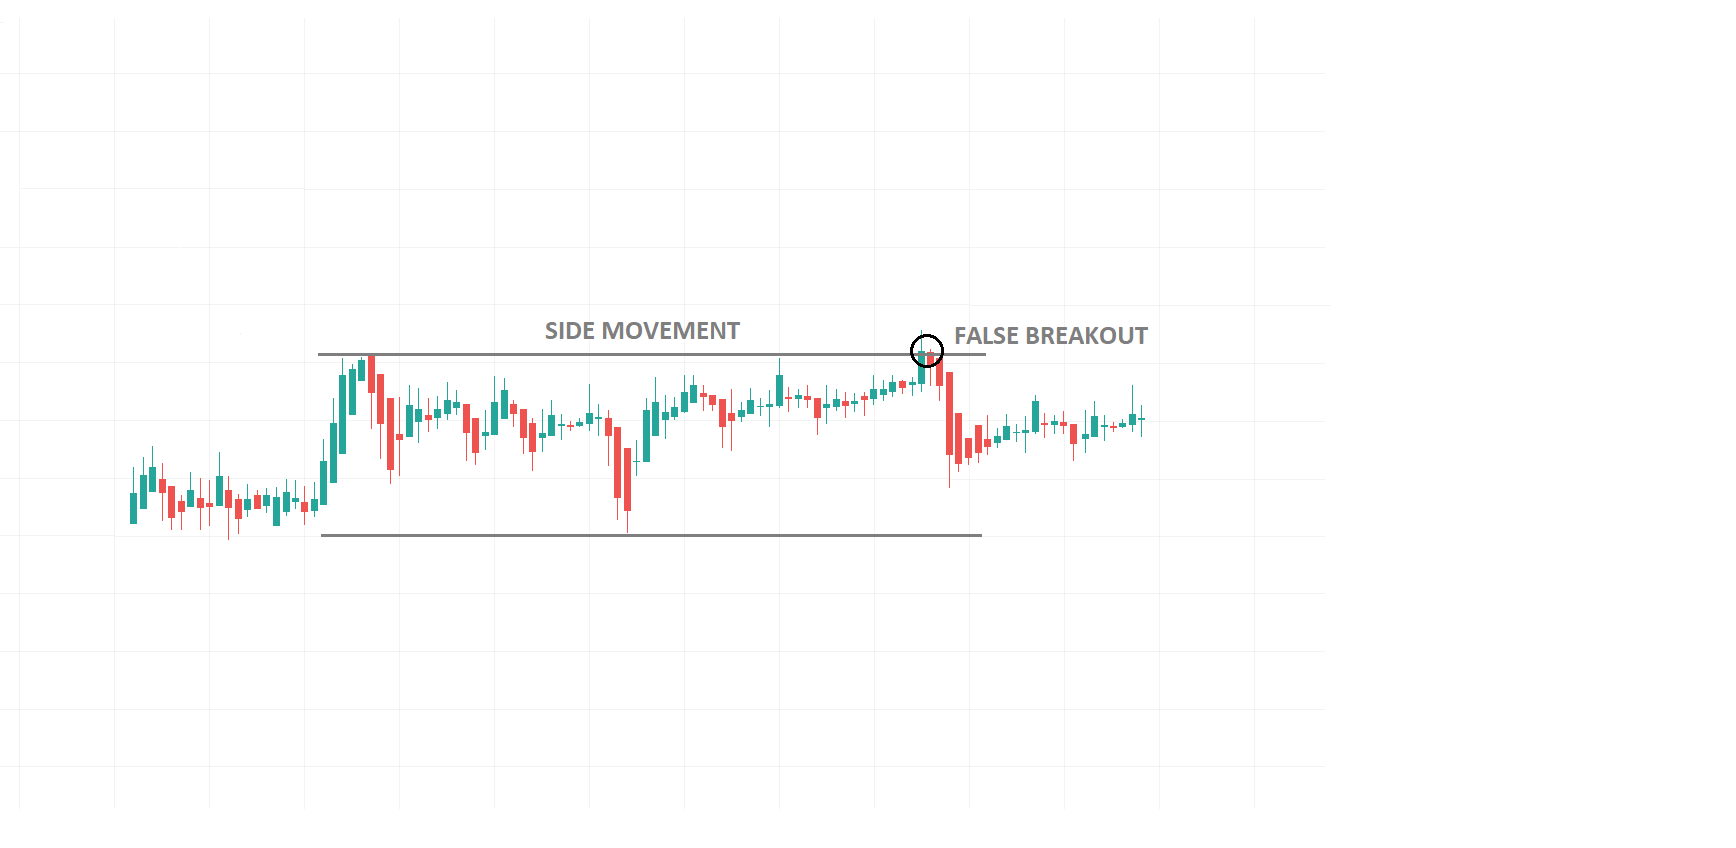
Breakouts can be categorised further into continuous, reversal or false breakouts. Something that all breakouts usually have in common is they occur after a period of consolidation, during which traders pause to consider their next actions. If traders decide that the trend is moving in the right direction, a continuation breakout could occur. If they believe the asset has been overbought, however, a reversal breakout could take place instead. Alternatively, a false breakout could result in a shortterm spike beyond the support or resistance level, only to return to the established areas.
Continuation Breakouts
Reversal Breakouts
False Breakouts
How to Identify Breakouts
At first, looking for breakouts can be a time-consuming process for traders who are new to the business. However, there are a few methods that have been designed to catch breakout points.
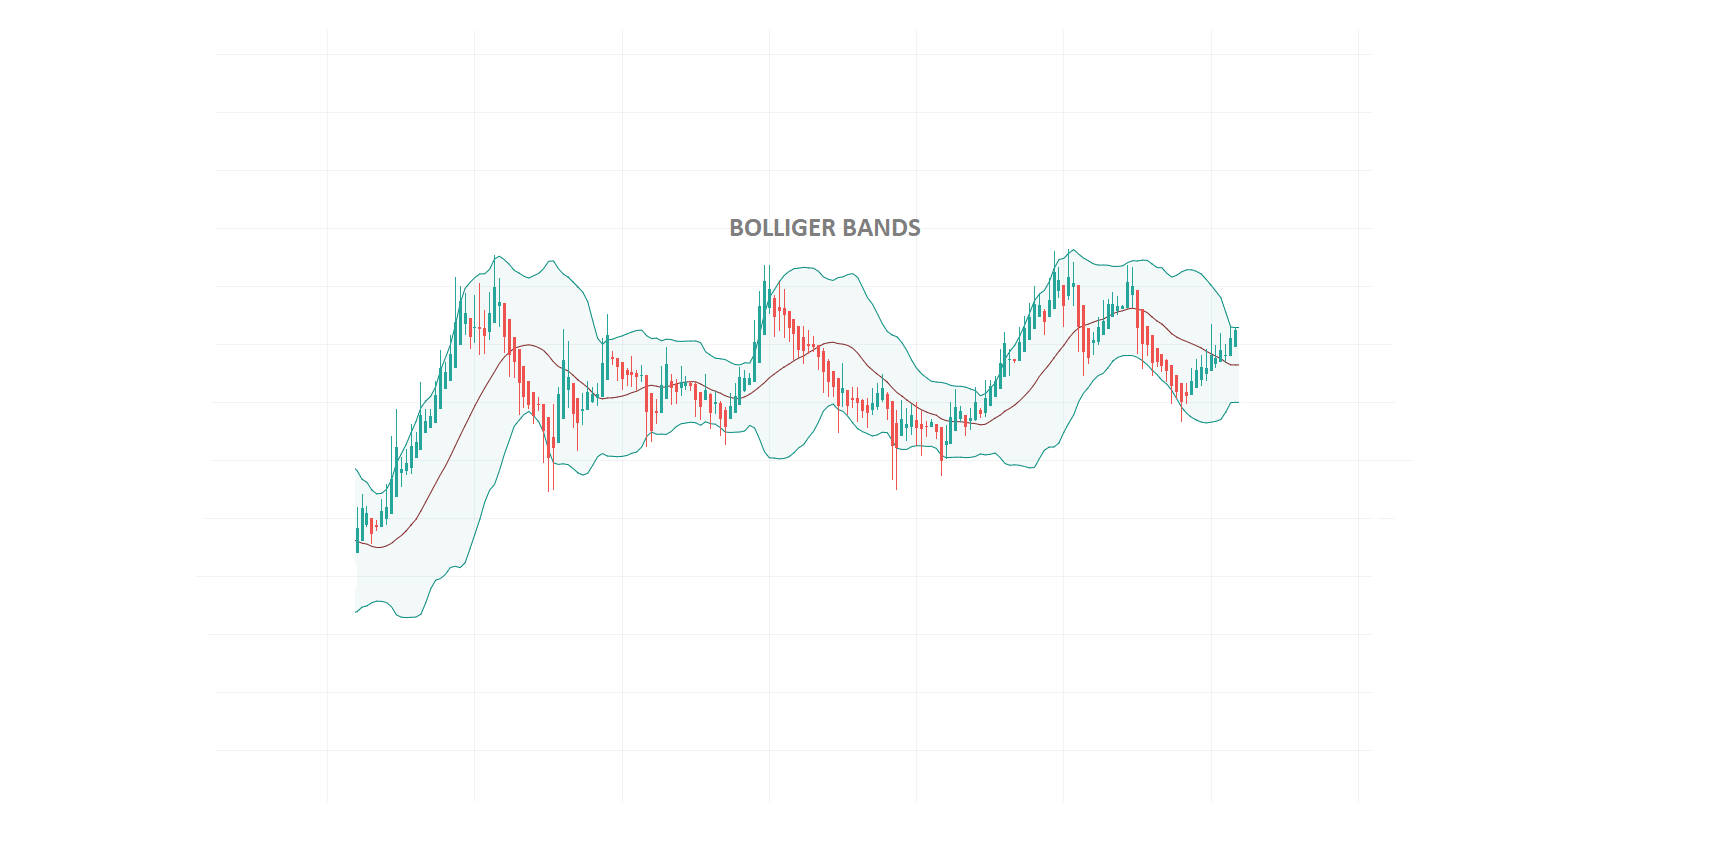
Bollinger Bands
Bollinger Bands are a technical indicator used to display areas of support and resistance on a price chart. They provide a visual representation of a breakout, as when prices reach the outer lines of the bands they often continue moving in the same direction, beyond the resistance or support lines. Traders can benefit from using Bollinger Band indicators by waiting for prices to move past the lines. As a general rule, the narrower the range, the tighter the period of consolidation. This means that once the breakout occurs, it will usually run with greater momentum.
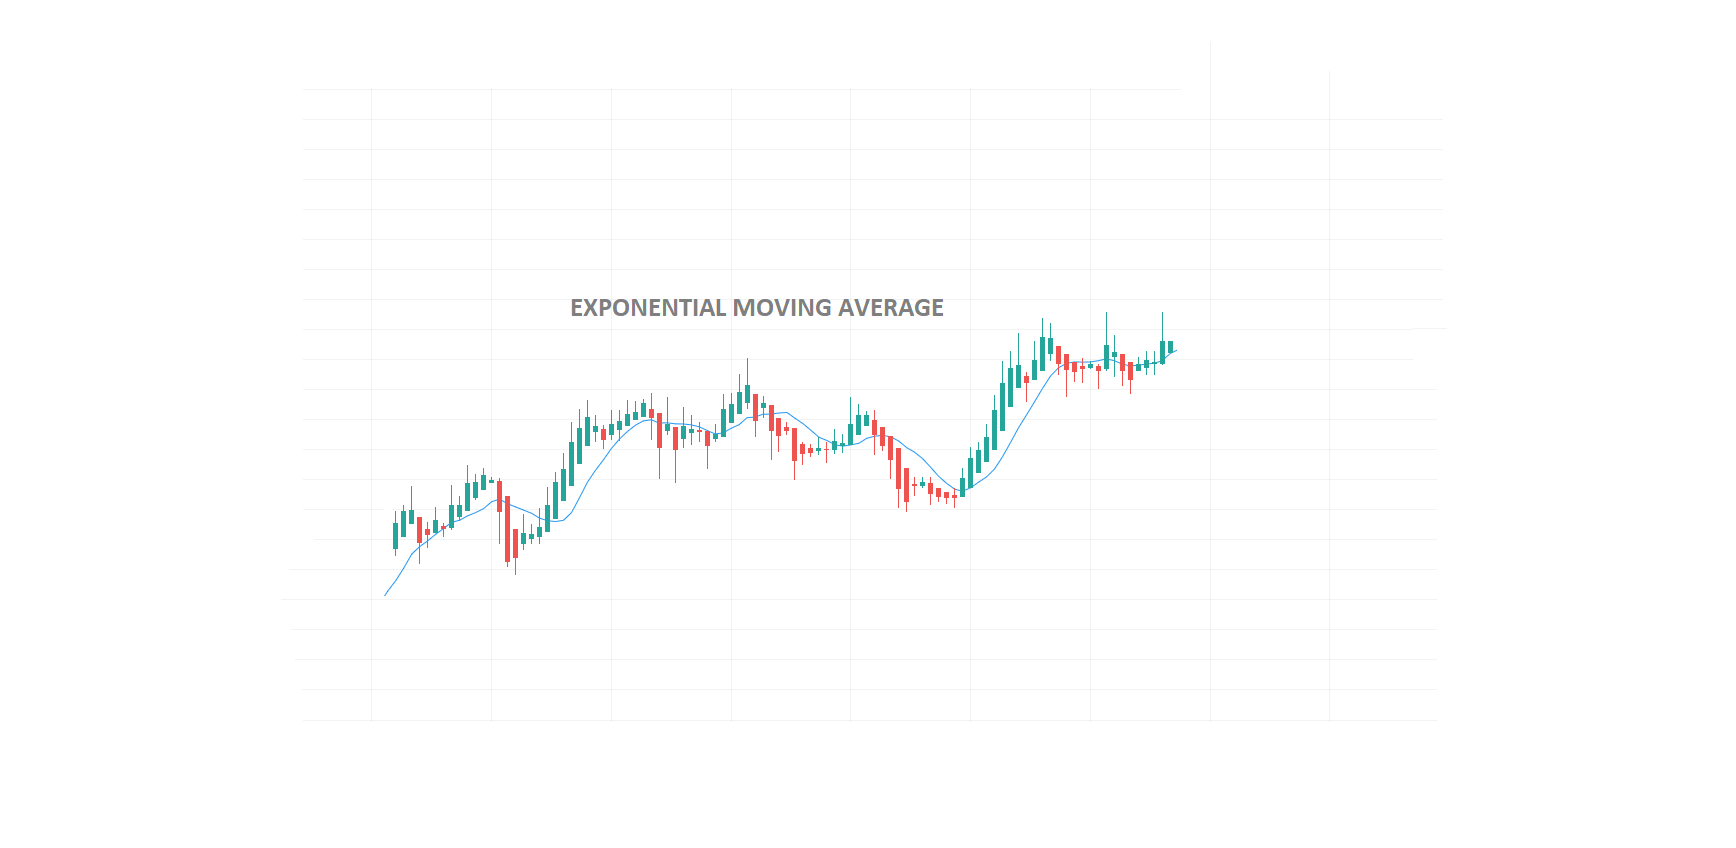
Exponential Moving Averages
Exponential Moving Averages (EMAs) are another indicator that can be used to trade Forex breakouts. By combining the 5, 30 and 50 period EMAs, you can pinpoint an upcoming breakout when the indicators flatten out. Once the shorter-term EMA breakout out from the established narrow range, it’s likely that an overall breakout will occur in the same direction.
Profit from Forex Breakouts
While no one strategy can guarantee high profits in every market, learning to understand how to trade Forex breakouts is a great skill to have. Practice trading Forex breakouts through a CedarFX demo account, or go live with a 0% Commission account or Eco Account.
Dedicated to bringing positive change to the environment, Eco Account holders can support CedarFX’s tree-planting mission, one trade at a time. Open an account with the world’s first Ecofriendly broker at www.cedarfx.com.
Author

Cedar FX Analysis Team
Cedar LLC


