The Most Used Candlestick Patterns

When trading forex, it is vital to engage with the most productive and professional technical tools possible. This will ultimately enhance your prospects and chances of success. Candlestick charting is one such technical tool. Candlestick charts originated in Japan more than a century ago, and have since become one of the most efficient ways to pack information into a single price bar.
Virtually all top forex brokers, like TradeFW.com, display candlestick charts and these are utilized by the majority of traders in the forex markets. A candlestick will display the daily open and close within the wide bodies section, and chart the daily high and low price, through the “shadow” or thin line extending from the top and bottom of the wide-bodied section. Varied colors are introduced to denote rising and falling markets, often red/green or black/white combinations. This is a very concise manner in which to display extensive forex trading data, and it is the collection of these candlesticks which will establish majorly identifiable patterns through which the market direction can be estimated.
Top Candlestick Patterns in Forex Trading
From their inception in 18th Century Japan to being introduced in the western world by Steve Nison in 1991, so many patterns have been identified. Of these patterns, there are several which you will see when trading forex which are important to identify and distinguish.
Engulfing Candlestick Pattern
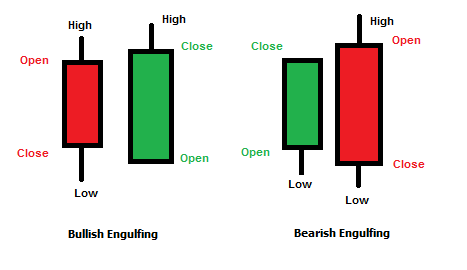
The engulfing candlestick pattern can form in both a bearish and bullish pattern. As displayed, for this to occur, the body of the days candle needs to fully engulf the opposing candle of the previous day. This can be either in a bullish or bearish pattern.
This pattern in trading has strong reversal properties. That means, if the next candle (engulfing candle) is bullish, there is a strong chance for a bullish pattern to develop. Also, if the engulfing candle is bearish, this could signal a reversal in the opposite direction.
A bullish engulfing pattern would indicate to an experienced forex trader, that the current market may have reached its bottom, or alternatively, a bearish engulfing pattern would indicate the peak has been reached.
Hammer Candlestick Pattern
The hammer is a one candlestick pattern which usually indicates a bullish reversal, coming at the end of a downtrend. Although this is identifiable from just one candlestick, there are a number of key characteristics which should be noted.
The hammer should be occurring at the bottom of a downtrend. The lower shadow of the candlestick should be at least double the length of the body, and the upper shadow should ideally be non-existent.
In terms of the candle body, it should indicate that the closing and high positions are similar, or that the open and high positions are similar. Either case shows that the bullish traders were able to combat the negative bear pressure within the market.
Harami Candlestick Pattern
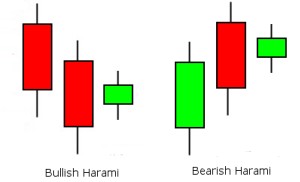
A Harami candlestick pattern can be noted in either bullish or bearish circumstances. Either way, it is a two-candlestick pattern which can be very important to forex trading strategy.
Bearish
A bearish Harami occurs following a large bullish candle before it. On the second candle, the opening price should be lower than the closing price of the previous day, and it does not have the ability to recover back to the previous day’s closing position.
Bullish
Similarly, a bullish Harami pattern will follow a large bearish candle from the previous day. In this case, the second candle will show an opening price higher than the closing price of the previous day. These gaps are essential in Harami formation. This price is then held up, without falling back to the close of the previous day, indicating a bullish pattern.
Piercing Candlestick Pattern
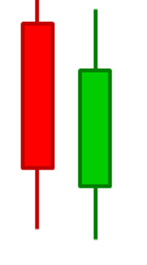
The Piercing candlestick is commonly regarded within forex trading as a bullish reversal pattern. This pattern requires the previous days candle to be largely bearish. The opening price of the candle will also have dropped below the closing price of the previous day to create a gap.
In the Piercing candlestick pattern, this gap will then be filled, with bullish behavior continuing to push the position upwards until the price closes more than half way up the bearish candle of the previous day. This represents a strong recovery of the previous day’s losses and a bullish trend.
Doji Candlestick Pattern
A Doji candlestick pattern is formed when the opening and closing prices of a candle are equal. This demonstrates a level of indecision within the market, since the positions have moved both upward and downward throughout the day, only to settle back at the same position.
The Doji can sometimes be seen at the end of trends and is considered by some forex trader’s and representative of a possible reversal, although this can just as easily be seen as a resting position for a market before it continues its current trend.
Shooting Star Candlestick Pattern
The Shooting Star is a bearish candlestick pattern which can signal the end of an uptrend. This is where they typically occur.
In a Shooting Star pattern, the open, low, and closing price are generally similar. This is combined with a long upper shadow, commonly more than double the length of the candle body. This would indicate that the market tried to push higher throughout the day, but ultimately fell back to near the opening level.
The pattern is considered to be more bearish if the closing position and daily low are the same.
Conclusion
Trading in the forex market especially, can be highly enticing due in part, to the lucrative returns which can potentially be made. Regardless of whether you are a new or experienced trader though, continued education is of vital importance. Learning about charting and the various candlestick charting patterns is a large part of this education.
As regards places to continue your learning and practice of candlestick charting, Tradefw.com provides the ideal learning infrastructure to allow you to practice more and grow you knowledge within one of the best forex brokers, who are completely regulated and highly regarded within the forex trading industry.
Author

TradeFW Team
TradeFW


