![]() Gabe Velázquez
Gabe Velázquez
Online Trading Academy
When searching for low risk opportunities, one situation that is not as common in the futures market as it is with stocks is the formation of gaps. The reason stocks tend to gap more often is simply because they spend much more time closed than they do trading with lots of volume. This exposes stocks to all types of gap risk, such as market risk or news related to the individual company. In contrast, because futures trade continuously twenty four hours a day, roughly five and a half days a week, most gaps are created on Sunday at the open and even then gaps are rare. Even more unusual are gaps formed in the middle of the week during earnings seasons. We’ll discuss these more later.
When Do Gaps Form in the Futures Market?
Because gaps are so uncommon in the futures market, when they do occur they can produce high probability opportunities. Since our main focus is finding price levels where the forces of supply and demand are most out of balance, what better example of this than a gap opening. Let’s think about how a gap occurs. In the chart below, note that the closing price of the March 2019 Natural Gas futures contract on Friday February 1st was 2.733, and on the following chart the opening price for Sunday was 2.705 This left a price gap of 28 ticks.
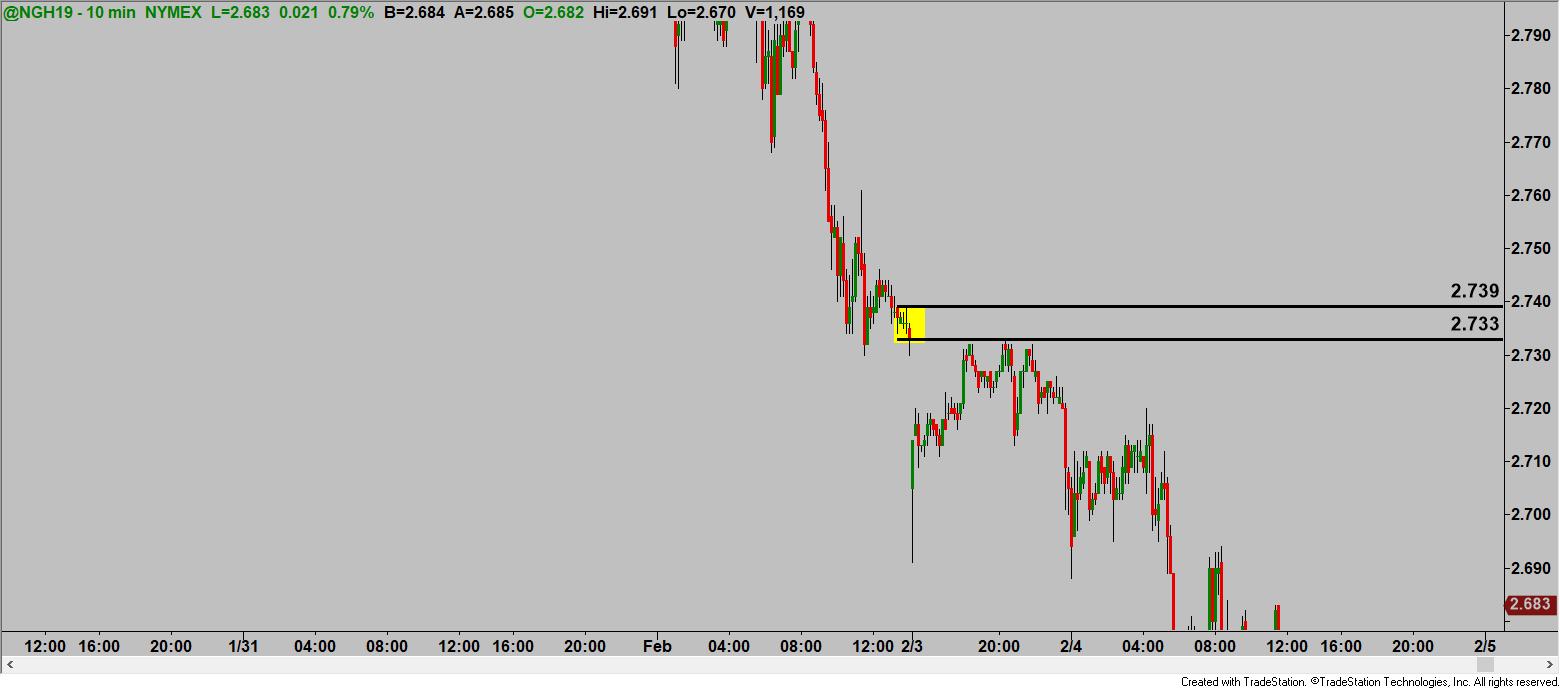
First, the simple fact is that when all the orders started to come in Sunday afternoon there were an abundance of sell orders hitting the tape, and since those orders have to be matched with buy orders the nearest buyer came 28 ticks lower. The reason that compelled so many to sell is irrelevant; and yes, you can find out why but that won’t help in finding a high quality trade. What’s most important here is that the creation of this gap represents the best picture of an imbalance of supply and demand. In this case, it is a supply imbalance. This suggests that there might be additional sell orders remaining to be filled.
As I mentioned earlier, the rarest of gaps are formed in the middle of the week. These typically form during reporting season for stocks. They occur because the stock index futures close for a very short period (15 minutes) every week day between 4:15 and 4:30 EST. This is when the day session ends and the overnight session begins. One such gap occurred on Thursday, January 31 as a result of news from one major Tech company that reported their earnings after the closing bell. These companies usually release their results a few minutes after the close producing a spike in price in the Futures market. In this instance, however, the company’s earnings hit the tape during the small window when the stock index futures were closed. The after-hours selling in this stock created this gap in the Nasdaq futures.
As we can see on the charts, this gap represented a low risk high probability shorting opportunity on the retracement back to the gap. To trade gaps properly, the odds enhancers, such as structure of the level, first retracement and so on, have to score high in order to enable a high quality opportunity.

All told, gaps represent a big order imbalance, and as such we must always be on high alert when they happen. There is one caveat though, not every gap is tradable. This has to do with where the gap was formed in terms of the location of the move. In other words, was the gap created in the late stages of a move, or near a reversal of the trend? This is key information before taking the trade. This a good starting point in understanding gaps, and I hope this was helpful. You can learn more about this topic and other assets by taking a free class near you.
Until next time, I hope everyone has a great trading week.
Read the original article here - The Gap Opportunity in Futures
This content is intended to provide educational information only. This information should not be construed as individual or customized legal, tax, financial or investment services. As each individual's situation is unique, a qualified professional should be consulted before making legal, tax, financial and investment decisions. The educational information provided in this article does not comprise any course or a part of any course that may be used as an educational credit for any certification purpose and will not prepare any User to be accredited for any licenses in any industry and will not prepare any User to get a job. Reproduced by permission from OTAcademy.com click here for Terms of Use: https://www.otacademy.com/about/terms
Editors’ Picks

EUR/USD weakens as US jobs data trims Fed rate cut bets
The EUR/USD pair trades in negative territory for the third consecutive day near 1.1860 during the early European session on Thursday. Traders will keep an eye on the US weekly Initial Jobless Claims data. On Friday, the attention will shift to the US Consumer Price Index inflation report.

GBP/USD bullish outlook prevails above 1.3600, UK GDP data looms
The GBP/USD pair gains ground near 1.3635, snapping the two-day losing streak during the early European session on Thursday. The preliminary reading of UK Gross Domestic Product for the fourth quarter will be closely watched later on Thursday. The UK economy is estimated to grow 0.2% QoQ in Q4, versus 0.1% in Q1.

Japanese Yen strengthens on renewed verbal intervention
USD/JPY extends its losses for the fourth successive session, trading around 152.90 during the Asian hours on Thursday. The pair weakens as the Japanese Yen strengthens following renewed verbal intervention from Tokyo.
Editors’ Picks
GBP/USD bullish outlook prevails above 1.3600, UK GDP data looms
The GBP/USD pair gains ground near 1.3635, snapping the two-day losing streak during the early European session on Thursday. The preliminary reading of UK Gross Domestic Product for the fourth quarter will be closely watched later on Thursday. The UK economy is estimated to grow 0.2% QoQ in Q4, versus 0.1% in Q1.
EUR/USD weakens as US jobs data trims Fed rate cut bets
The EUR/USD pair trades in negative territory for the third consecutive day near 1.1860 during the early European session on Thursday. Traders will keep an eye on the US weekly Initial Jobless Claims data. On Friday, the attention will shift to the US Consumer Price Index inflation report.

Gold remains on the defensive below two-week top; lacks bearish conviction amid mixed cues
Gold sticks to modest intraday losses through the Asian session on Thursday, though it lacks follow-through selling and remains close to a nearly two-week high, touched the previous day. The commodity currently trades above the $5,070 level, down just over 0.20% for the day, amid mixed cues.

UK GDP set to post weak growth as markets rise bets on March rate cut
Markets will be watching closely on Thursday, when the United Kingdom’s Office for National Statistics will release the advance estimate of Q4 Gross Domestic Product. If the data land in line with consensus, the UK economy would have continued to grow at an annualised pace of 1.2%, compared with 1.3% recorded the previous year.

The market trades the path not the past
The payroll number did not just beat. It reset the tone. 130,000 vs. 65,000 expected, with a 35,000 whisper. 79 of 80 economists leaning the wrong way. Unemployment and underemployment are edging lower. For all the statistical fog around birth-death adjustments and seasonal quirks, the core message was unmistakable. The labour market is not cracking.
RECOMMENDED LESSONS
Making money in forex is easy if you know how the bankers trade!
I’m often mystified in my educational forex articles why so many traders struggle to make consistent money out of forex trading. The answer has more to do with what they don’t know than what they do know. After working in investment banks for 20 years many of which were as a Chief trader its second knowledge how to extract cash out of the market.
5 Forex News Events You Need To Know
In the fast moving world of currency markets where huge moves can seemingly come from nowhere, it is extremely important for new traders to learn about the various economic indicators and forex news events and releases that shape the markets. Indeed, quickly getting a handle on which data to look out for, what it means, and how to trade it can see new traders quickly become far more profitable and sets up the road to long term success.
Top 10 Chart Patterns Every Trader Should Know
Chart patterns are one of the most effective trading tools for a trader. They are pure price-action, and form on the basis of underlying buying and selling pressure. Chart patterns have a proven track-record, and traders use them to identify continuation or reversal signals, to open positions and identify price targets.
7 Ways to Avoid Forex Scams
The forex industry is recently seeing more and more scams. Here are 7 ways to avoid losing your money in such scams: Forex scams are becoming frequent. Michael Greenberg reports on luxurious expenses, including a submarine bought from the money taken from forex traders. Here’s another report of a forex fraud. So, how can we avoid falling in such forex scams?
What Are the 10 Fatal Mistakes Traders Make
Trading is exciting. Trading is hard. Trading is extremely hard. Some say that it takes more than 10,000 hours to master. Others believe that trading is the way to quick riches. They might be both wrong. What is important to know that no matter how experienced you are, mistakes will be part of the trading process.
The challenge: Timing the market and trader psychology
Successful trading often comes down to timing – entering and exiting trades at the right moments. Yet timing the market is notoriously difficult, largely because human psychology can derail even the best plans. Two powerful emotions in particular – fear and greed – tend to drive trading decisions off course.