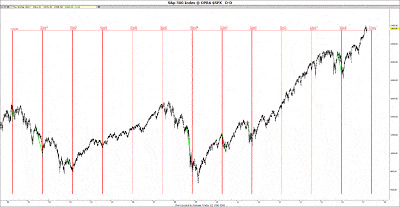
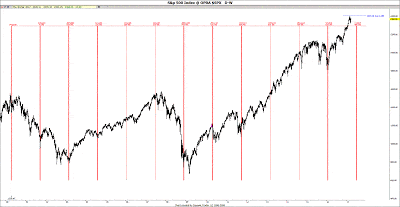
The May 6 2010 mini Crash became known as the Flash Crash. I first discovered a 360 Trading Day (TD, Gann’s 360 degrees) cycle and posted it on my public blog, when the Flash Crash occurred, which is why I named it the Flash Crash (FC) cycle of Lows.
The 360 TD Cycle is about 75 weeks, which has been in the markets ever since the April 14 2000 mini Crash Low and has since pinpointed 8 major crash Lows in the past 17 years, including the 4/14/00 mini crash Low, 9/21/01 crash Low, 3/12/03L, 8/13/04L, 11/2108 crash Low, 5/6/10 Flash Crash, 10/04/11 Low and more recently the 1/20/16 crash Low.
Many of the 360 TD/75 week flash crash cycle Lows were major Panic Lows, like the 4/14/00 Low, 9/21/01 Panic Low and the 11/21/08 Banking crisis Low. A few, like the 3/12/03 Low and 8/13/04 Low were not Panic Lows, but still major Lows. At times the FC Cycle skips a beat, out of the last 12, 8 (67%) were direct hits and 4 (33%) were misses.
The dominant Flash Crash 360 TD / 75 week Cycle:
04/14/00L – 09/21/01L = 01 X 358.00 TD = 01 X 525 CD = 01 X 75.00 weeks
04/14/00L – 03/12/03L = 02 X 363.50 TD = 02 X 531 CD = 02 X 75.86 weeks
04/14/00L – 08/13/04L = 03 X 362.00 TD = 03 X 527 CD = 03 X 73.33 weeks
04/14/00L – 11/21/08L = 06 X 360.67 TD = 06 X 524 CD = 06 X 74.83 weeks
04/14/00L – 05/06/10L = 07 X 361.14 TD = 07 X 525 CD = 07 X 74.98 weeks
04/14/00L – 10/04/11L = 08 X 360.63 TD = 08 X 524 CD = 08 X 74.82 weeks
04/14/00L – 01/20/16L = 11 X 360.36 TD = 11 X 524 CD = 11 X 74.79 weeks
04/14/00L – June 2017 = 12 X 360.00 TD
04/14/00L – July 2017 = 12 X 75 weeks
The Flash Crash Lows were preceded by an average 18% decline:
04/14/00 Crash Low saw a 213.57 SP decline, a 14% decline.
09/21/01 Crash Low saw a 371.18 SP decline, a 28% decline.
03/12/13 major Low saw a 165.38 SP decline, a 17% decline
08/13/04 major Low saw a 102.51 SP decline, a 9% decline.
11/21/08 Crash Low saw a 699.36 SP decline, a 49% decline
05/06/10 Flash Crash saw a 139.34 SP decline, a 12% decline
10/04/11 Crash Low saw a 295.81 SP decline, a 22% decline.
01/20/16 Crash Low saw a 322.43 SP decline, a 15% decline.
The exact 360 Trading Day cycle has deviated by only 2 to 8 TD:
04/14/00L +360 TD X 1 = 09/21/01 Crash Low, + 2 TD
04/14/00L +360 TD X 2 = 03/12/03 Major Low, - 7 TD
04/14/00L +360 TD X 3 = 08/13/04 Major Low, - 6 TD
04/14/00L +360 TD X 6 = 11/21/08 Crash Low, - 4 TD
04/14/00L +360 TD X 7 = 05/06/10 Flash Crash, - 8 TD
04/14/00L +360 TD X 8 = 10/04/11 Crash Low, – 5 TD
04/14/00L +360 TD X 11 = 01/20/16 Crash Low, – 4 TD
Swing High before the Flash Crash Low
03/24/00H – 04/14/00L = 021 CD / 0.7 Months
05/22/01H – 09/21/01L = 122 CD / 4.0 months
12/02/02H – 03/12/03L = 100 CD / 3.3 months
06/24/04H – 08/13/04L = 050 CD / 1.7 Months
08/11/08H – 11/21/08L = 102 CD / 3.4 Months
04/26/10H – 07/01/10L = 066 CD / 2.2 Months
07/07/11H – 10/04/11L = 089 CD / 2.9 Months
11/03/15H – 01/20/16L = 078 CD / 2.6 Months
The declines from the swing High to the Flash crash Lows have averaged 78.5 CD or 2.6 Months +/-. The majority has varied from 2.2–3.4 months. This means we should top out an average of 2 ½ months before the projected June-July Flash Crash Lows.
The Biblical 7 year Cycle and the 360 TD Flash crash Cycle
“The future 9/28/15 Blood Moon total Lunar Eclipse is another biblical 7 years/1800 TD (Trading Days) from the 8/11/08 swing High, before the panic into 11/21/08 crash Low, which was 1805 TD from the 9/21/01 Crash Low and 1800 TD in the future is January 2016.”
5 X 360 TD Flash Crash cycle is the 1800 TD cycle, which is the well known 7 year Biblical cycle, which suggested a sharp decline in January 2016, being 7 years/1800 TD, from the 11/21/08 Crash Lows, which was 7 years/1805 TD from the 9/21/01 Crash Lows. The 1800 TD Cycle varies between 1790 and 1805 TD.
This 1800 TD/7 year cycle+/- has pinpointed major Highs and Lows in the past:
-
10/11/07H – 12/05/14H =1800 TD
-
08/13/04L – 10/04/11L = 1798 TD
-
03/12/03L – 04/26/10H = 1793 TD
-
03/12/03L – 05/06/10L = 1801 TD (Flash Crash)
-
09/21/01L – 11/21/08L = 1805 TD
-
09/01/00H – 10/11/07H = 1785 TD
-
08/11/08H - 09/28/15H = 1792 TD
-
11/21/08L – 01/20/16L = 1800 TD
Conclusion: The Flash Crash Cycle of Lows pinpointed 8 major crash Lows, in the past 17 years, with an 18% average decline and has deviated maximum 2-8 TD from its exact 360 TD cycle. It has a 67% chance of seeing a decline into it. The 1800 TD/ 7 Year Cycle is 5 X 360 TD cycle, which has also has pinpointed major Highs and Lows in the past, including the recent 1/20/16 Low. If we are going to see a Flash Crash we should see a major swing High about 2 ½ months before we see a sharp 18% decline into the June-July Flash Crash Lows. That means we should top out in April or even as early as today’s 3/30-31 cycle High. You won’t want to miss the upcoming decline. Be forewarned and be prepared.
Trading in Stocks, ETF, Options and Futures involve risks. Trade at your own Risk. Do your own homework. The contents of this blog are for general information and educational purposes only and should not be construed as an investment advice strategy. Past performance is no guarantee of future results.
Editors’ Picks

USD/JPY gathers strength to near 157.50 as Takaichi’s party wins snap elections
The USD/JPY pair attracts some buyers to around 157.45 during the early Asian session on Monday. The Japanese Yen weakens against the US Dollar after Japan’s ruling Liberal Democratic Party won an outright majority in Sunday’s lower house election, opening the door to more fiscal stimulus by Prime Minister Sanae Takaichi.

Gold: Volatility persists in commodity space
After losing more than 8% to end the previous week, Gold remained under heavy selling pressure on Monday and dropped toward $4,400. Although XAU/USD staged a decisive rebound afterward, it failed to stabilize above $5,000. The US economic calendar will feature Nonfarm Payrolls and Consumer Price Index data for January, which could influence the market pricing of the Federal Reserve’s policy outlook and impact Gold’s performance.

AUD/USD eyes 0.7050 hurdle amid supportive fundamental backdrop
AUD/USD builds on Friday's goodish rebound from sub-0.6900 levels and kicks off the new week on a positive note, with bulls awaiting a sustained move and acceptance above mid-0.7000s before placing fresh bets. The widening RBA-Fed divergence, along with the upbeat market mood, acts as a tailwind for the risk-sensitive Aussie amid some follow-through US Dollar selling for the second straight day.

Week ahead: US NFP and CPI data to shake Fed cut bets, Japan election looms
US NFP and CPI data awaited after Warsh’s nomination as Fed chief. Yen traders lock gaze on Sunday’s snap election. UK and Eurozone Q4 GDP data also on the agenda. China CPI and PPI could reveal more weakness in domestic demand.

Three scenarios for Japanese Yen ahead of snap election Premium
The latest polls point to a dominant win for the ruling bloc at the upcoming Japanese snap election. The larger Sanae Takaichi’s mandate, the more investors fear faster implementation of tax cuts and spending plans.
RECOMMENDED LESSONS
Making money in forex is easy if you know how the bankers trade!
I’m often mystified in my educational forex articles why so many traders struggle to make consistent money out of forex trading. The answer has more to do with what they don’t know than what they do know. After working in investment banks for 20 years many of which were as a Chief trader its second knowledge how to extract cash out of the market.
5 Forex News Events You Need To Know
In the fast moving world of currency markets where huge moves can seemingly come from nowhere, it is extremely important for new traders to learn about the various economic indicators and forex news events and releases that shape the markets. Indeed, quickly getting a handle on which data to look out for, what it means, and how to trade it can see new traders quickly become far more profitable and sets up the road to long term success.
Top 10 Chart Patterns Every Trader Should Know
Chart patterns are one of the most effective trading tools for a trader. They are pure price-action, and form on the basis of underlying buying and selling pressure. Chart patterns have a proven track-record, and traders use them to identify continuation or reversal signals, to open positions and identify price targets.
7 Ways to Avoid Forex Scams
The forex industry is recently seeing more and more scams. Here are 7 ways to avoid losing your money in such scams: Forex scams are becoming frequent. Michael Greenberg reports on luxurious expenses, including a submarine bought from the money taken from forex traders. Here’s another report of a forex fraud. So, how can we avoid falling in such forex scams?
What Are the 10 Fatal Mistakes Traders Make
Trading is exciting. Trading is hard. Trading is extremely hard. Some say that it takes more than 10,000 hours to master. Others believe that trading is the way to quick riches. They might be both wrong. What is important to know that no matter how experienced you are, mistakes will be part of the trading process.
The challenge: Timing the market and trader psychology
Successful trading often comes down to timing – entering and exiting trades at the right moments. Yet timing the market is notoriously difficult, largely because human psychology can derail even the best plans. Two powerful emotions in particular – fear and greed – tend to drive trading decisions off course.


