After a lot of attention being given to trends recently, I decided to compile the most thorough guide. You will find a few different techniques on how to define whether a market is TRENDING (up or down) or TRADING (or in other words in a range).
What is a trend?
“The trend is your friend“, as the common saying states. Why is it that some traders prefer to trade with the trend and others are more contrarian in nature? Is one or the other approach more profitable in the long-term? How to decide whether trend following or range trading is more profitable? Is there a way we can clearly define a trend? All of those questions and a lot more will be covered in the essay below. I have put a lot of thought and effort into writing that article and now the time has come to share it with you. So, what is a trend? A lot has been written on that topic and a lot more could be said. Maybe before defining a trend, we must say that there are two types of trends: A)Uptrend and B)Downtrend and let’s not forget about C)Range (No Trend)
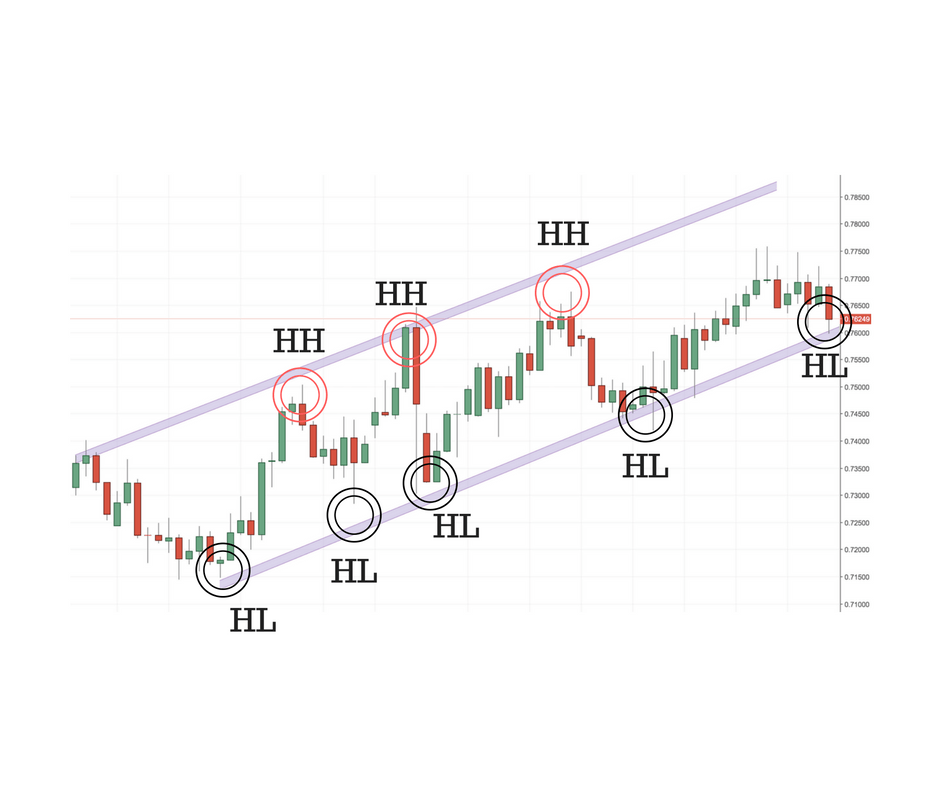
A) Uptrend- an uptrend is defined as a sequence of higher highs (HH) and higher lows (HL) as the example below is showing
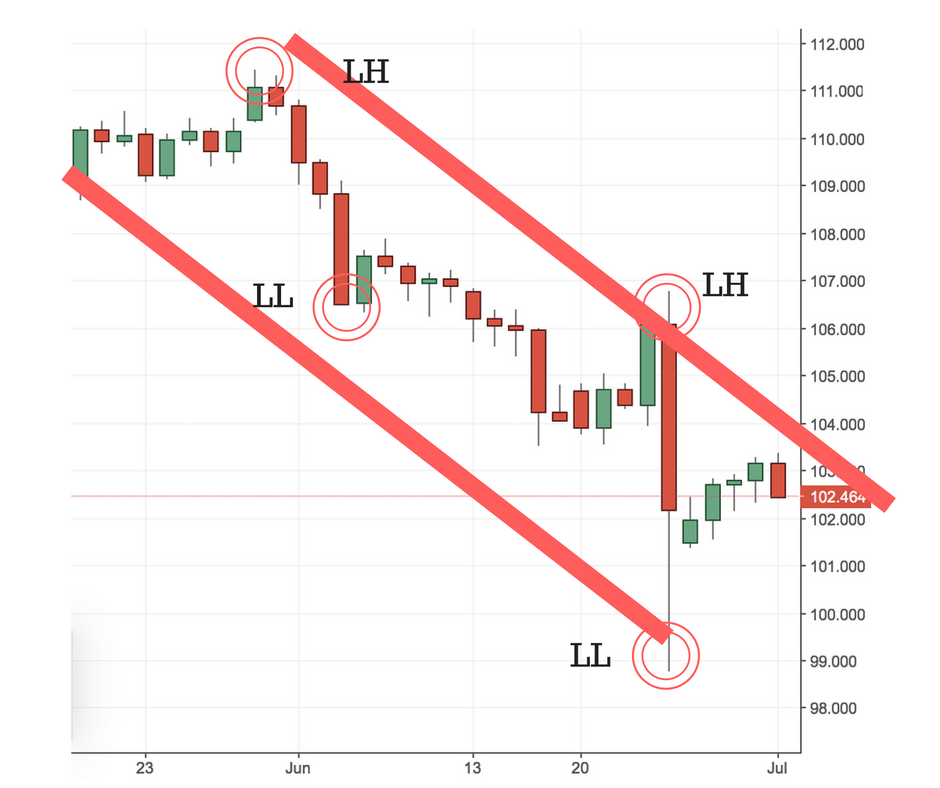
B) Downtrend- a downtrend is a sequence of lower highs (LH) and lower lows (LL) as the example below reveals
A trend is the general direction that a certain financial instrument is taking; a trend varies in length (duration)- it can be a short, intermediate or long. These are hard to pinpoint, since different traders have different understanding of the duration of trends. What is important to realise here is that you can define a trend by its duration, as well. Trend analysis is a section of technical analysis that explains trends and helps traders define direction.
C) Range (No Trend)– the last option is a range. A range is an area, where there is no well-defined direction. It is neither up, nor down. The price deviates between two boundaries and resembles a ball bouncing up and down between a floor and a ceiling:
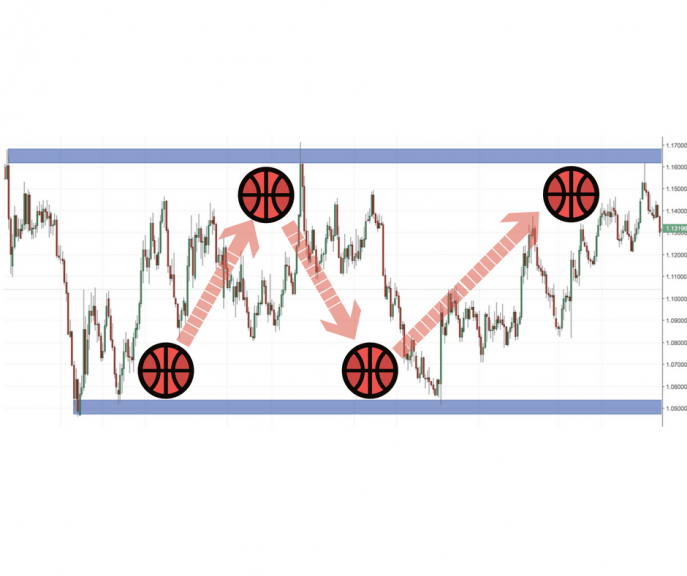
Usually traders that trade the range buy when price touches the lower boundary and sell when it goes up to the upper boundary.
Trading the Trend
One popular trading strategy is waiting for price to touch the trend line and trade it. So, let’s say we are in an uptrend. Once the price makes a higher low and touches the lower trend line, traders will be buying. The same happens in a downtrend. Once the price makes a lower high, traders will be trading the trend line and selling. In a range (no trend) trend followers try not to trade. Traders trading the range are buying when price touches support and selling when it touches resistance. These look like a simple to execute trading strategies, but they could be quite subjective. One of the problems that arise from them is where to draw a trend line. Should you connect the lows/highs or the open/close of the candle. This is probably the hardest decision to make once deciding on a trend line. I usually look at the extreme points or the high and low values as opposed to the open/close. For me the highest and lowest values are an indication of how much or less are traders willing to pay to hold an instrument. That is why I do prefer those values and not the open and close of the trading session.
Other popular tools to use when trading the trend
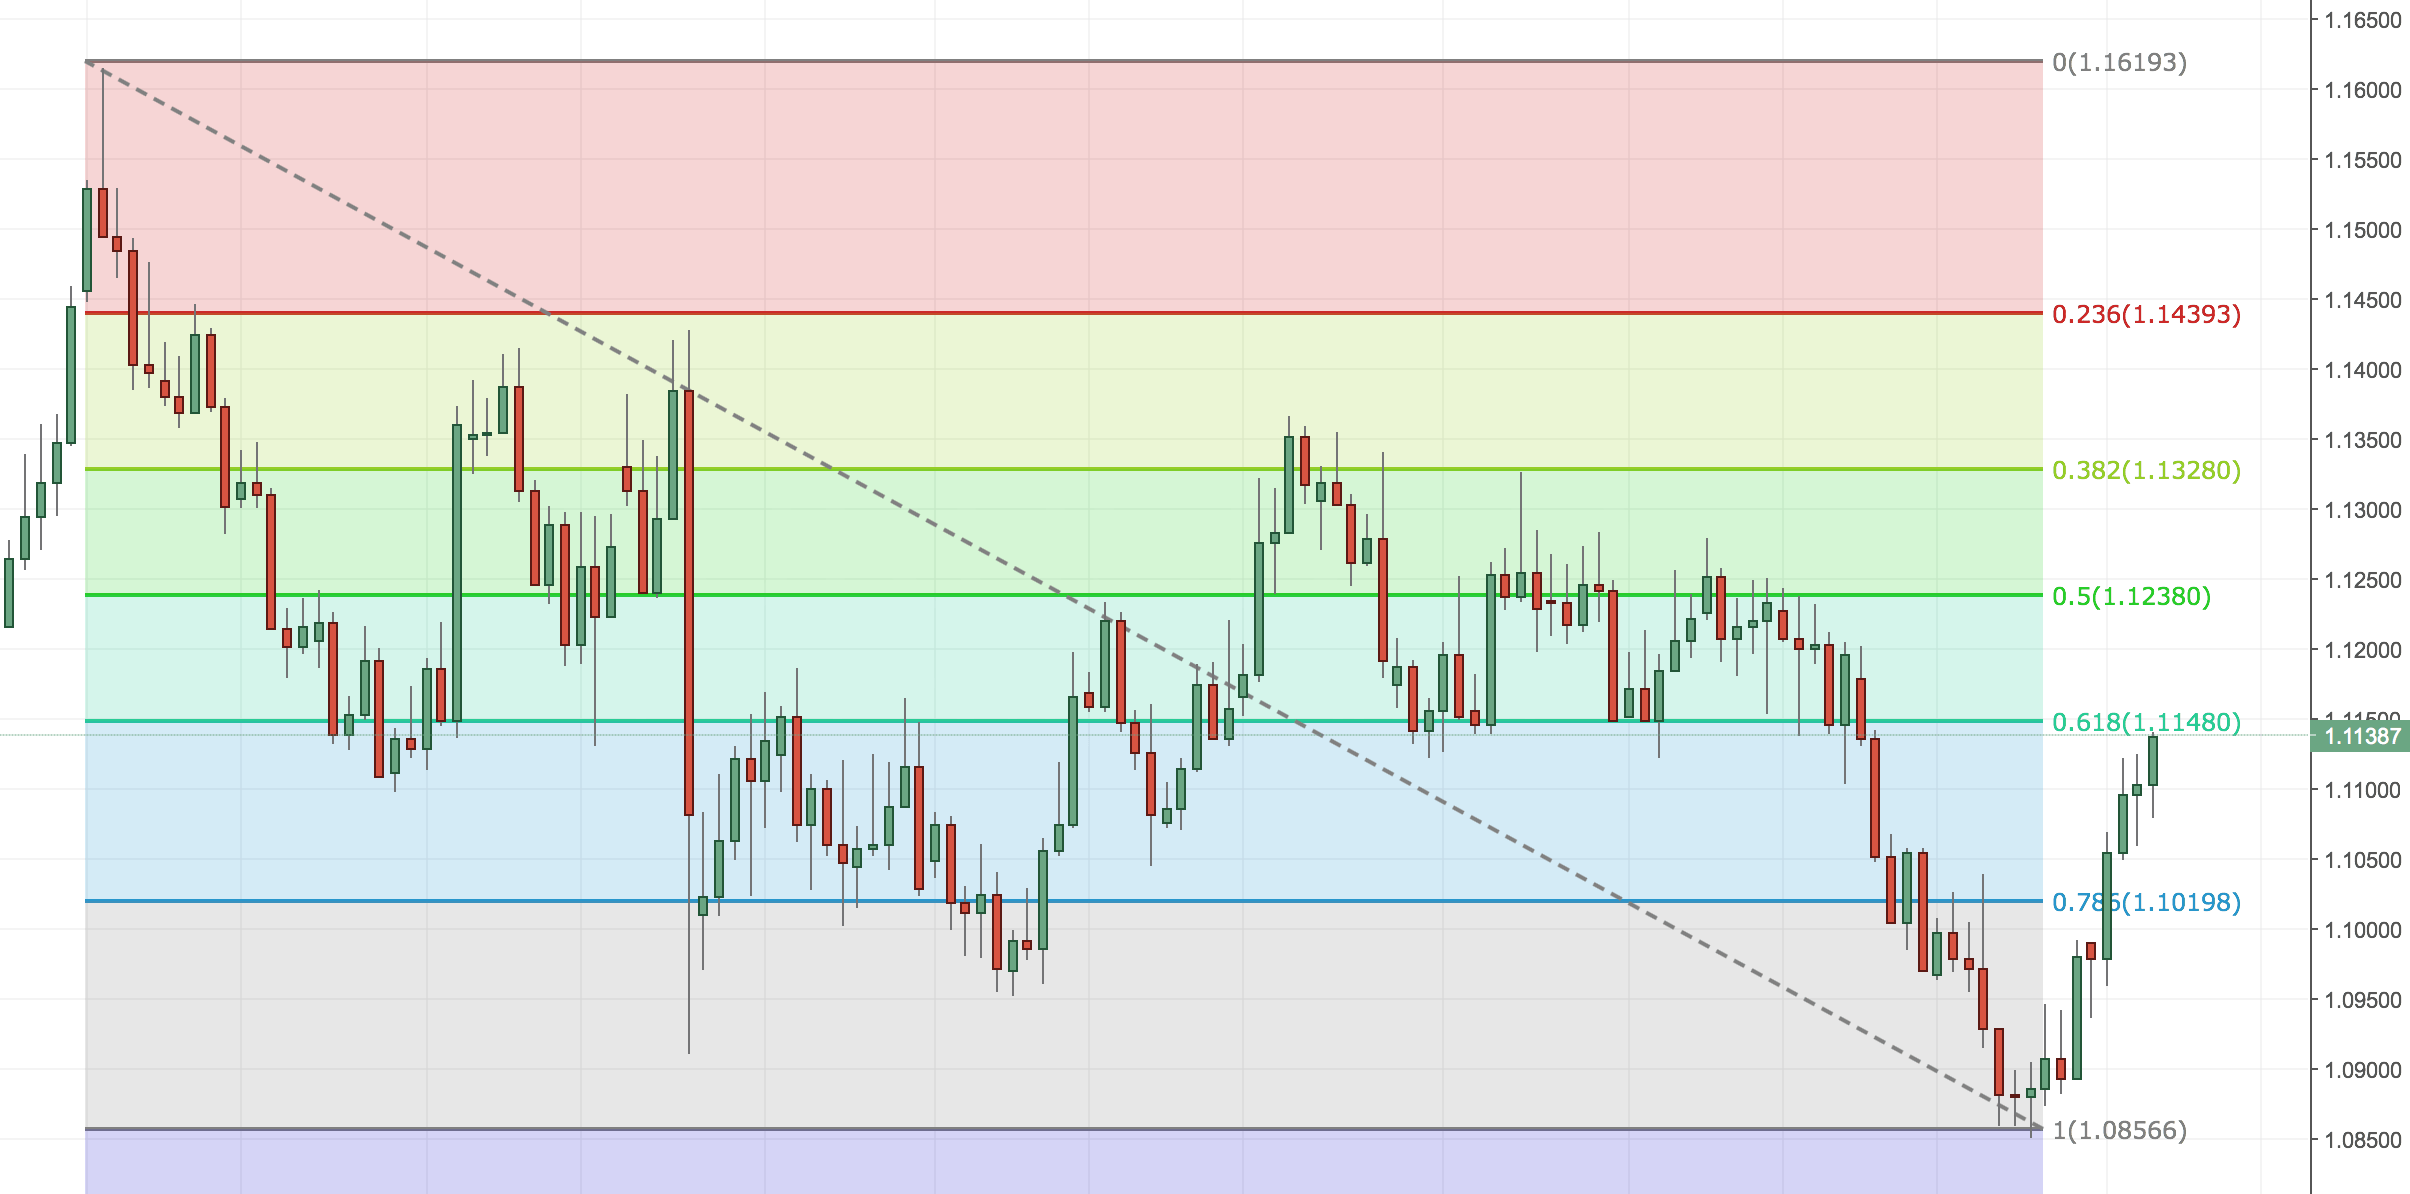
Fibonacci Levels– Some traders use Fibonacci levels in order to follow the trend. Once a new high has been formed, traders to draw the Fibonacci retracements in order to see where they can re-enter in a trade. Four of the most popular Fibonacci levels are: 23.6%, 38.2%, 50%, 61.8%. These are highly pursued levels by a significant amount of traders. Once these levels are identified, horizontal lines are drawn in order to define levels of support/resistance just like the chart below.
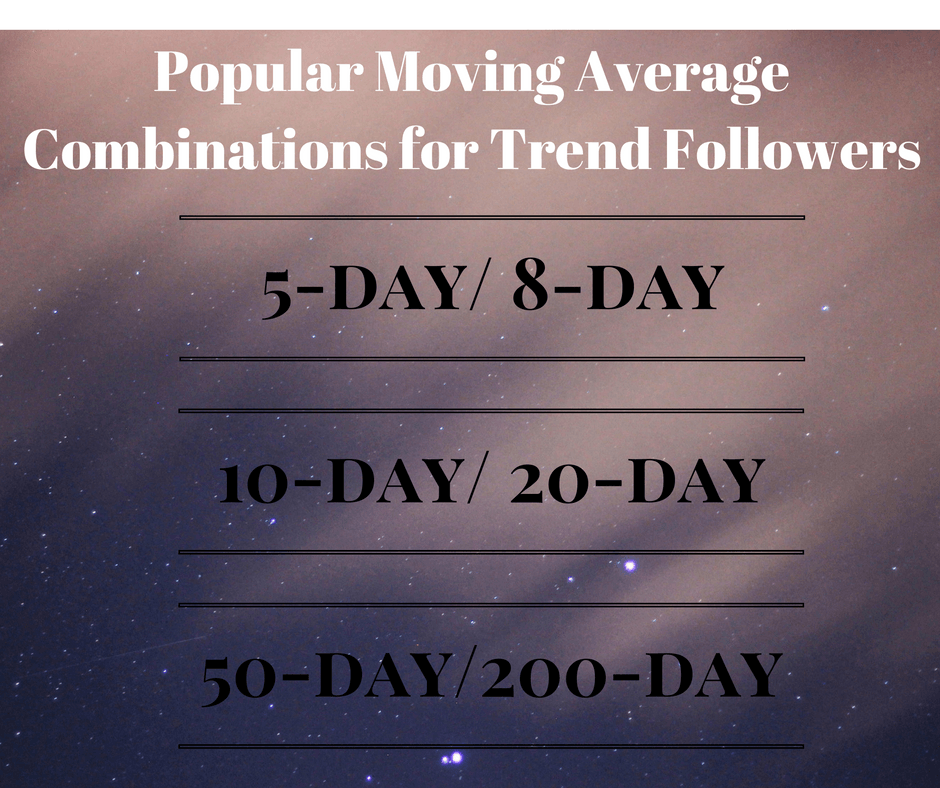
Moving Averages- Another popular approach to look at the markets is through the prism of the Moving Averages. Moving Averages are calculated by taking the average value of a financial instrument over a certain amount of time. Amongst the popular Moving Averages (MA) are 5-day, 8-day, 20-day, 50-day and 200-day. For example, a 50-day MA would be calculated by summing up all of the past 50 days’ closing values and dividing them by 50. There are different types of moving averages and the calculations are different, but that is not what this article is about. Therefore, I will skip the mathematical explanations and more like emphasise on the ways traders use them to follow the trend.
Moving Averages Trend Following Strategies
A) Moving Averages– The first and one of the easiest way to define a trend is by using moving averages. For this purpose a lot of traders are using Simple or Exponential Moving Averages. For the sake of this example, we will use an exponential moving averages. It was not going to make a significant difference if we were using simple moving averages. In the first example below, you will see the chart of Gold. There are two moving averages (50Days and 20Days). There are different ways to use moving averages, but here I will emphasise on the trend. How to decide whether Gold is moving up or down or is locked in a range. In the example below you can see an uptrend. If the price stands above the moving averages, we have an uptrend. If the price stays below the moving averages, we have a downtrend. If the price dynamically changes from below to above the moving averages, then there is a range-trading environment. Therefore, based on this definition, trend followers only buy when the price is above the Moving Averages in an uptrend and only sell when the price drops below the moving averages in a downtrend.
B) Moving Average Crossover– Another popular trading strategy is by combining two moving averages and looking for a crossover. A popular combination of Moving Averages is 10-day and 20-day. So, what traders that are following the trend will do is wait for a crossover. The crossover occurs when the shorter moving average crosses above the longer moving average in an uptrend and vice versa. In that moment, a lot of traders will try to follow the trend by opening a long/short position depending on the crossover. (NB: Bullish Crossover is when the shorter-term moving average crosses ABOVE the longer-term one. Bearish Crossover is when the shorter-term moving average crosses BELOW the longer-term moving average). In the example below, you can see a bearish crossover in the Moving Average Exponential Ribbon. This leads us to the next type of crossover…
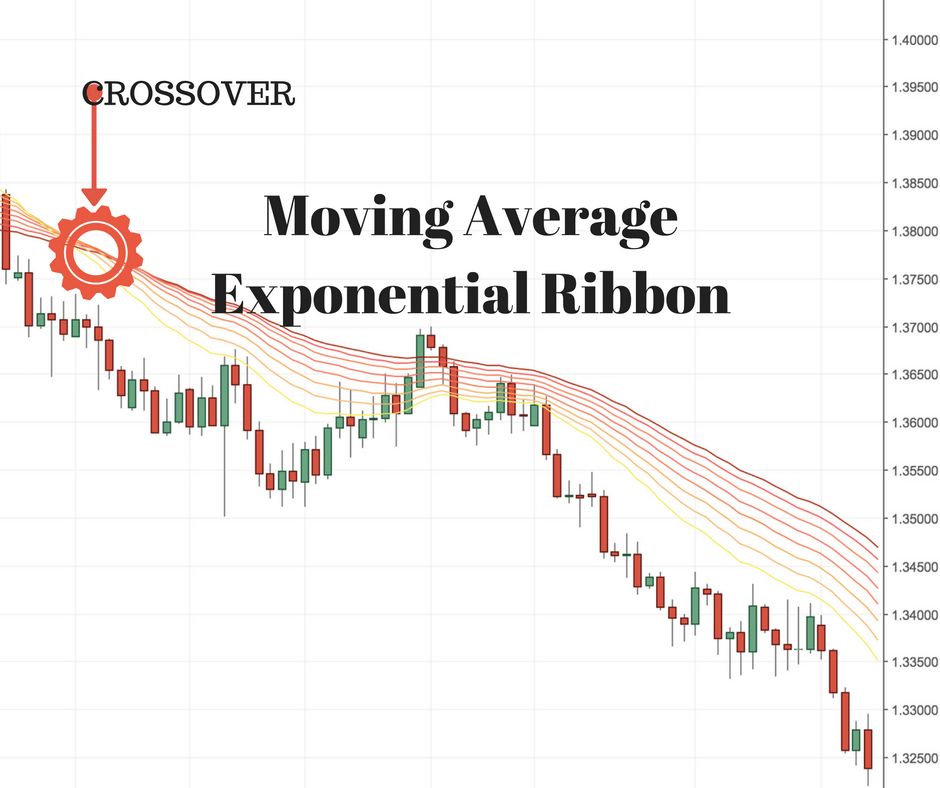
C) Moving Average Exponential Ribbon– Another popular trend-following strategy is a combination between 3 or more moving averages, a.k.a. Moving Average Exponential ribbon. This is an overlay of multiple moving averages as shown on the image above. I will try to not to give too many details around those, as this is not the purpose of this article. The main thing here as with the other moving average strategies for following the trend is to have a visible crossover. The example above is showing a bearish crossover on the EUR/USD pair, which is also where the sell signal occurs. What you need to pay attention to here is that you know how to differentiate between the different approaches to follow the trend by using Moving Averages.
Support and Resistance
A lot of the traders I know (including me) are using support and resistance in order to decide where to enter into a long/short trade. There are various techniques and ways to use support and resistance and I have a very detailed article written about that HERE. For the sake of this article, I will give an example of how support and resistance could be used to trade with the trend.
A) Trading Channels– The majority of traders (excluding me) like to use diagonal lines. They find them really helpful in analysing the next move in a certain security. In the example below, you can see this diagonal channel in action:
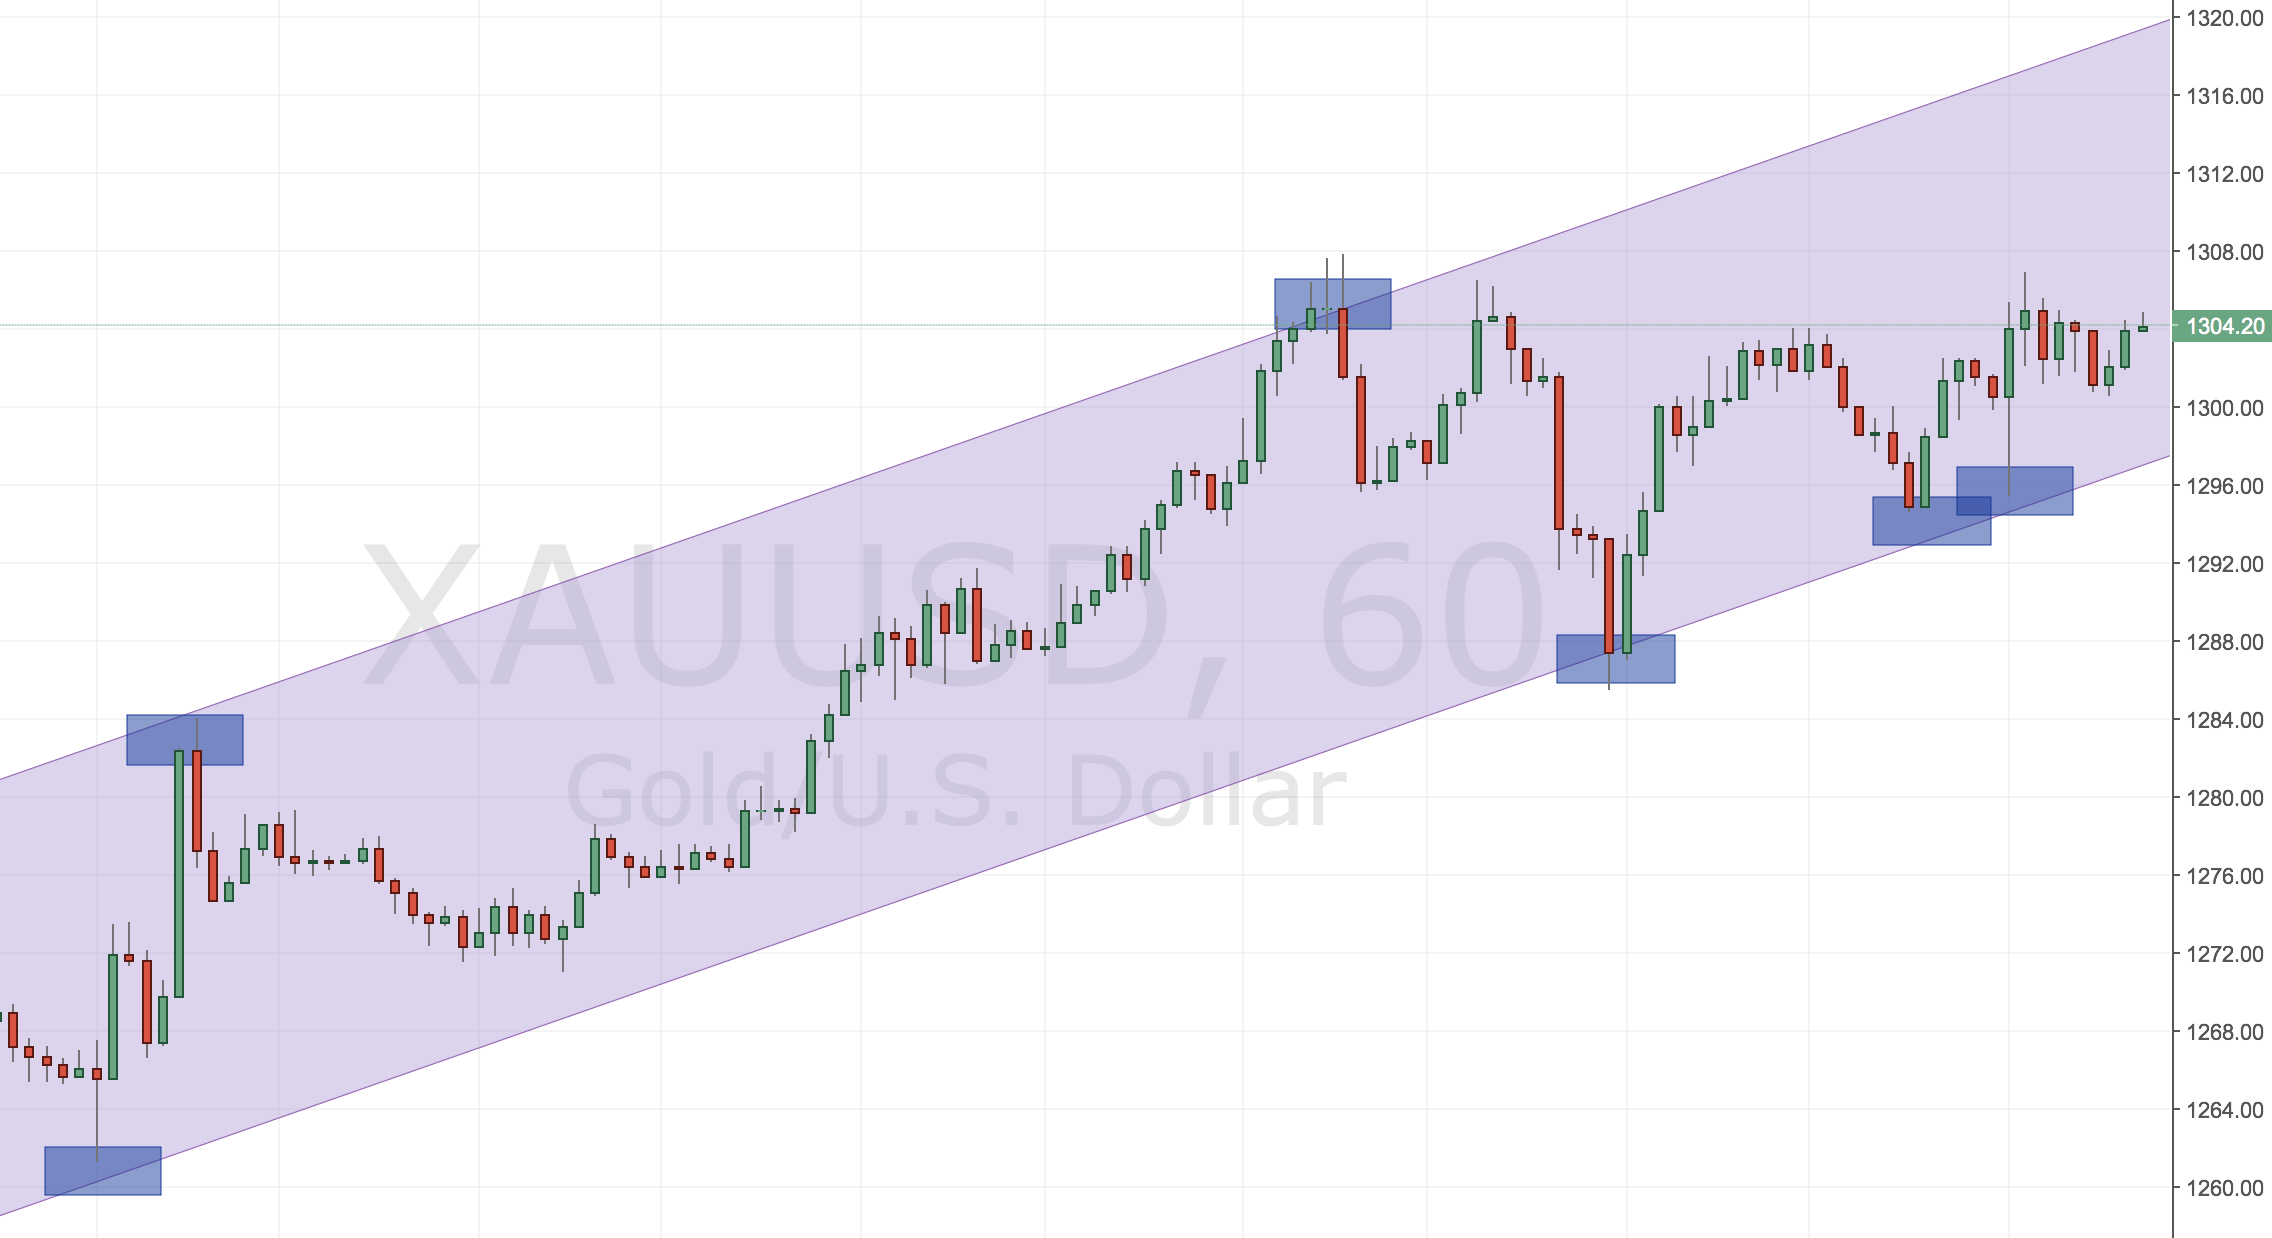
What traders are doing in an uptrend is buying when the price touches the lower line of the channel. In a downtrend, they are selling when price touches the upper line of the trading channel. Although, this is not my favourite trading strategy, a lot of trend followers are using it. I find it more subjective and that is why I do prefer to use only horizontal lines for support and resistance like the example below:
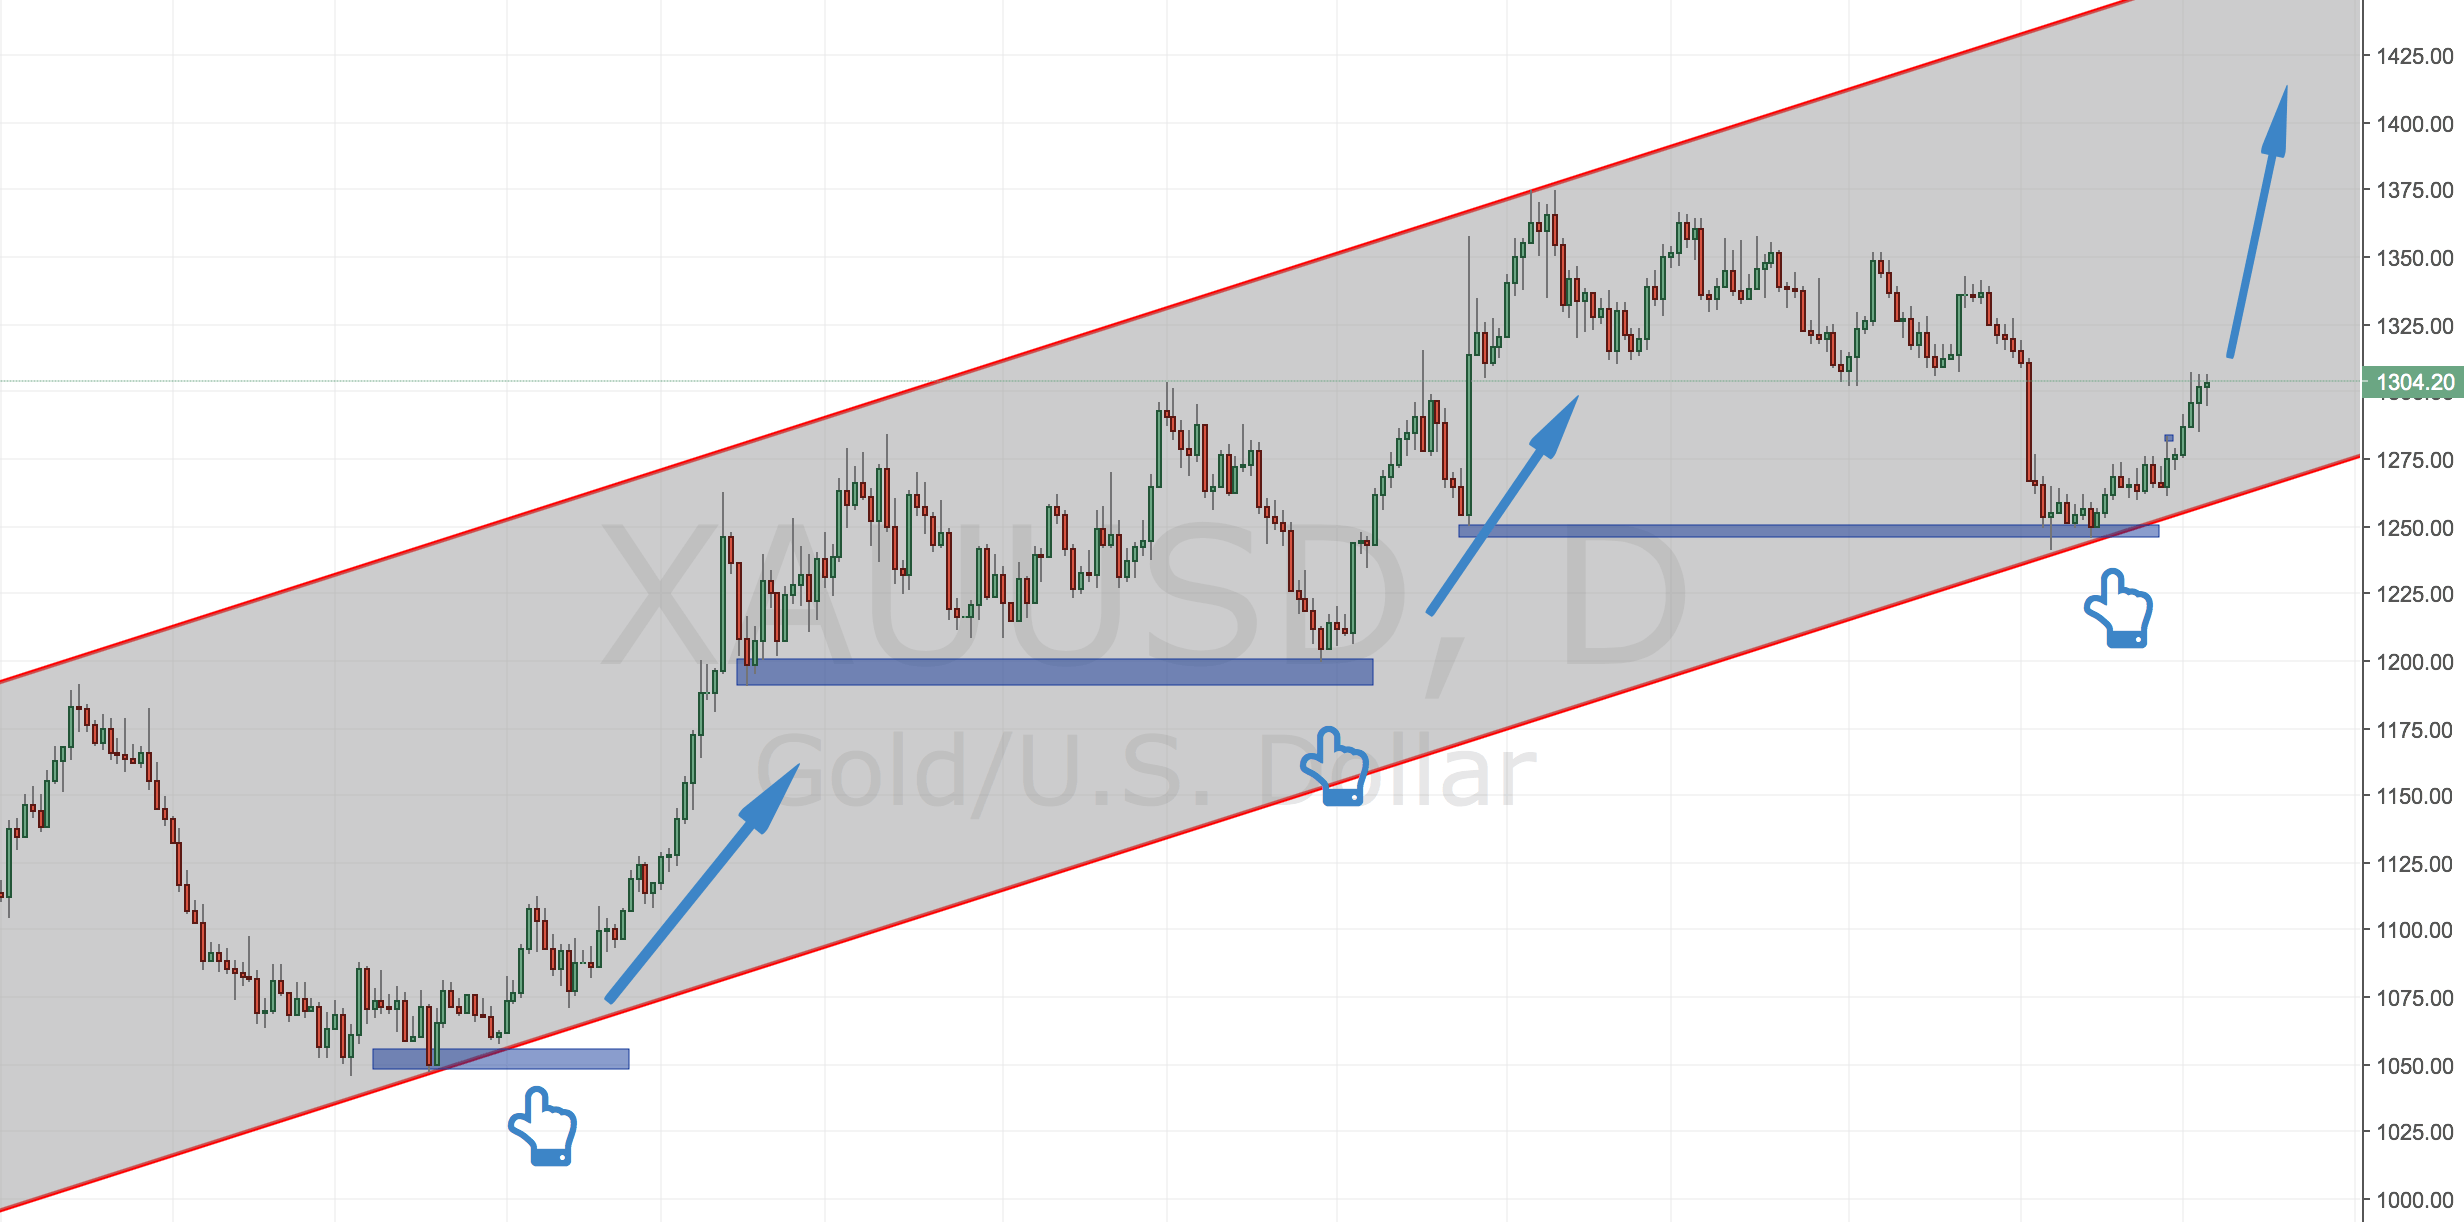
B) Support and Resistance Levels– With this method, I am usually looking for a pull-back towards the previous support level (in an uptrend) to initiate my trades. I find this way much more effective and definitely less subjective. In my past support and resistance article, I have explained in more details why is that. In case you want to familiarise yourself better with this way, please read the before mentioned article.
There are a lot of different ways to follow the market. Whole trading schools of thought have been dedicated to this idea. In a book called “The Way of the Turtle“, Curtis Faith is explaining how two legendary traders taught 23 ordinary people from all walks of life of their secretive trading system of following the trends. The author himself was one of the youngest of this group, who made over 30 million trading the system for about 4 years. This was just another way of trend following the market. In the end of the day, it is hard to say whether it is easier (or more profitable) to follow the trend or be a contrarian. Maybe the following years will prove to be more unpredictable and better suited for contrarian traders. Or maybe, algorithms will completely change the way trading is done.
Common Mistakes When Trading The Trend
In this section, I will walk you through some of the common trading mistakes when following the trend.
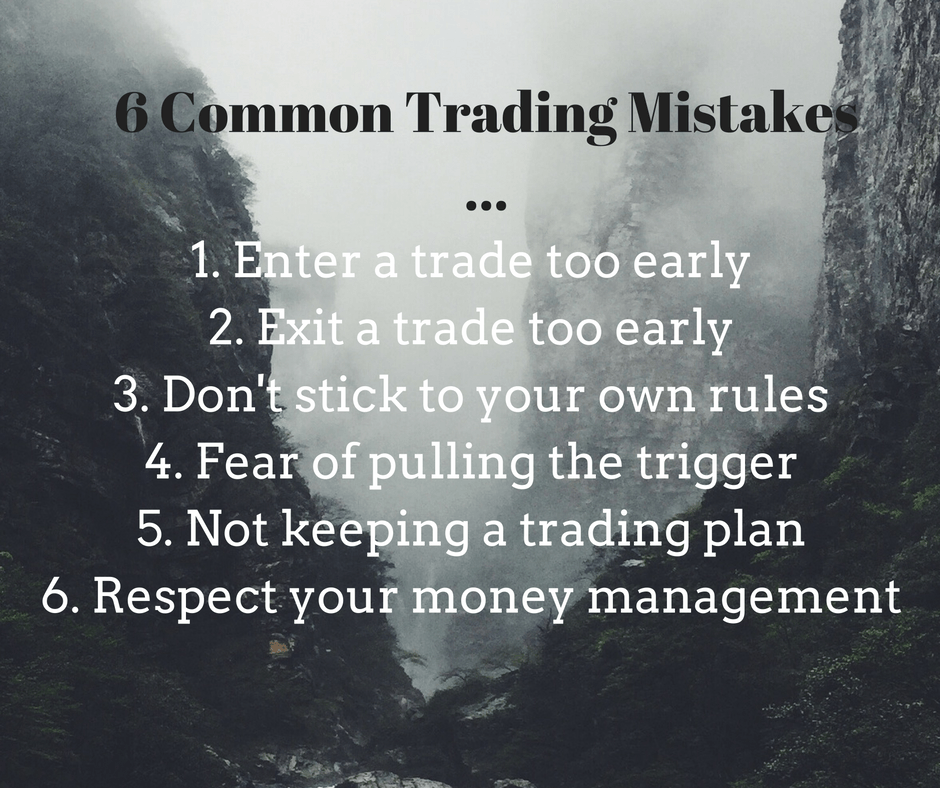
- Enter too early– very often traders do enter trades prematurely. They don’t have the patience to sit and wait and that usually costs them dearly. To become a consistently profitable trader, one needs to master this skill.
- Exit too early– the opposite mistake of the one before is exiting a trade too early. There is a saying that you need to cut your losses fast and let winners run as long as possible. This cannot be better suited for this case. The majority of traders are swung between greed and fear. They do not know when to exit a trade and this reduces their chances of winning this game in the long-term. Imagine what a system that helps you run your profits would do to your equity curve. Once again- patience pays back!
- Don’t stick to your rules– another famous mistake traders make is not following their own rules. This is as common as rain in England! You should have your trading rules written down on a piece of paper (or sticky notes) and have them in front of you when trading. Traders are not the most rational of human beings, therefore TRADING RULES should be in front of your eyes when trading.
- Fear of pulling the trigger– Another common mistake that trend followers make is fearing to place a trade. That’s not only a beginner’s fear, but also every experienced trader’s nightmare after a losing streak. A good solution for that could be staying away from the markets for a while or trading on a Demo until you regain confidence.
- Not keeping a trading plan, so you don’t repeat the same mistakes again– Keeping a trading plan is amongst the most important skills of the profitable trader.
- Have a rigid money management agenda– Some say that money management is probably the hardest of all aspects of trading. It seems easy to the newcomer, but definitely harder it is when trading larger size. If you don’t have the right money management methodology, in moments of panic you might do critical mistakes if you don’t have the right risk parameters. Have a look at the screenshot below and feel free to share if you believe that some of your trading friends are doing those mistakes!
How to keep your discipline and follow the trend
- Have a clearly written trading plan– As written above, it is highly recommended that trend followers (among other traders) have a written trading plan. It will help you not only when your equity curve is going up, but mostly when you are at a losing streak. Being able to control your emotions might not be that easy, especially if you are day trading. That’s why, having a trading plan is the way to follow your principles. What I have on my desk are the most important rules written on sticky notes. If you are not sure, you can start by even printing the above image and placing it next to your trading screen.
- Rule two is follow your plan- Repetition is the mother of learning. Although it may sounds as a cliche, it is no less true that repetition makes your trading understanding better. Don’t waste more time, but read again rule number 1!
- Rule three is– always follow your plan no matter what other indicators are saying. Follow your pre-defined trend-following system if you want to achieve the results you are after. By jumping from one trading strategy to another, you are not doing yourself a favour. Stick to your rules!
Avoid the range… or maybe not
In the end, why is it so scary to trade the range. Isn’t the market range-trading in 80% of the time? Should you only trade the market when it is in a trend? Should you be more flexible and try to take advantage of both market conditions? These are probably some of the most quintessential questions that traders are usually asking themselves. What matters for you as a trader is your equity curve to be in an uptrend. Our inborn desire to be always right and feed our ego is probably what drives traders to be constantly on the search for a holy-grail strategy that works in all market conditions. That is not what trading should be about. As boring as it might sound, when trading the markets you should be looking after two things:
A) Growing your P/L
B) Following your trading plan
I am convinced that the majority of traders do not follow those two simple principles. No wonder that 95% of the traders are losing their hard-earned money in trading. As long as the need to feed your ego is out there, you will not reach consistency. That is how I came to the conclusion that you are not making the money in range-trading environment or by following the trend, but by following your already proven trading methodology.
This material is written for educational purposes only. By no means do any of its contents recommend, advocate or urge the buying, selling or holding of any financial instrument whatsoever. Trading and Investing involves high levels of risk. The author expresses personal opinions and will not assume any responsibility whatsoever for the actions of the reader. The author may or may not have positions in Financial Instruments discussed in this newsletter. Future results can be dramatically different from the opinions expressed herein. Past performance does not guarantee future results.
Editors’ Picks

EUR/USD extends its optimism past 1.1900
EUR/USD retains a firm underlying bid, surpassing the 1.1900 mark as the NA session draws to a close on Monday. The pair’s persistent uptrend comes as the US Dollar remains on the defensive, with traders staying cautious ahead of upcoming US NFP prints and CPI data.

GBP/USD hits three-day peaks, targets 1.3700
GBP/USD is clocking decent gains at the start of the week, advancing to three-day highs near 1.3670 and building on Friday’s solid performance. The better tone in the British Pound comes on the back of the intense sekk-off in the Greenback and despite re-emerging signs of a fresh government crisis in the UK.

USD/JPY bounces off lows, back above 156.00
USD/JPY is starting the week markedly on the defensive, sliding back toward the 155.50 area where it has met some decent contention for now. The move lower in spot follows FX intervention chatter after PM S. Takaichi scored a landslide win in Sunday’s election..
Editors’ Picks

AUD/USD gets ready to punch through 0.7100
The intense sell-off in the Greenback underpins the solid performance of the Aussie Dollar on Monday, motivating AUD/USD to add to recent gains while challenging the key 0.7100 barrier, or fresh YTD highs, at the same time.
EUR/USD extends its optimism past 1.1900
EUR/USD retains a firm underlying bid, surpassing the 1.1900 mark as the NA session draws to a close on Monday. The pair’s persistent uptrend comes as the US Dollar remains on the defensive, with traders staying cautious ahead of upcoming US NFP prints and CPI data.

Gold picks up pace, retargets $5,100
Gold gathers fresh steam, challenging daily highs en route to the $5,100 mark per troy ounce in the latter part of Monday’s session. The precious metal finds support from fresh signs of continued buying by the PBoC, while expectations that the Fed could lean more dovish also collaborate with the uptick.

XRP struggles around $1.40 despite institutional inflows
Ripple (XRP) is extending its intraday decline to around $1.40 at the time of writing on Monday amid growing pressure from the retail market and risk-off sentiment that continues to keep investors on the sidelines.

Japanese PM Takaichi nabs unprecedented victory – US data eyed this week
I do not think I would be exaggerating to say that Japanese Prime Minister Sanae Takaichi’s snap general election gamble paid off over the weekend – and then some. This secured the Liberal Democratic Party (LDP) an unprecedented mandate just three months into her tenure.
RECOMMENDED LESSONS
Making money in forex is easy if you know how the bankers trade!
I’m often mystified in my educational forex articles why so many traders struggle to make consistent money out of forex trading. The answer has more to do with what they don’t know than what they do know. After working in investment banks for 20 years many of which were as a Chief trader its second knowledge how to extract cash out of the market.
5 Forex News Events You Need To Know
In the fast moving world of currency markets where huge moves can seemingly come from nowhere, it is extremely important for new traders to learn about the various economic indicators and forex news events and releases that shape the markets. Indeed, quickly getting a handle on which data to look out for, what it means, and how to trade it can see new traders quickly become far more profitable and sets up the road to long term success.
Top 10 Chart Patterns Every Trader Should Know
Chart patterns are one of the most effective trading tools for a trader. They are pure price-action, and form on the basis of underlying buying and selling pressure. Chart patterns have a proven track-record, and traders use them to identify continuation or reversal signals, to open positions and identify price targets.
7 Ways to Avoid Forex Scams
The forex industry is recently seeing more and more scams. Here are 7 ways to avoid losing your money in such scams: Forex scams are becoming frequent. Michael Greenberg reports on luxurious expenses, including a submarine bought from the money taken from forex traders. Here’s another report of a forex fraud. So, how can we avoid falling in such forex scams?
What Are the 10 Fatal Mistakes Traders Make
Trading is exciting. Trading is hard. Trading is extremely hard. Some say that it takes more than 10,000 hours to master. Others believe that trading is the way to quick riches. They might be both wrong. What is important to know that no matter how experienced you are, mistakes will be part of the trading process.
The challenge: Timing the market and trader psychology
Successful trading often comes down to timing – entering and exiting trades at the right moments. Yet timing the market is notoriously difficult, largely because human psychology can derail even the best plans. Two powerful emotions in particular – fear and greed – tend to drive trading decisions off course.