The Most Comprehensive Article On Support and Resistance Online- Whatever your day-trading system is, there are important levels in every trading session that you totally should pay attention to if you are to be consistently successful. In this article, I will quickly describe those levels so you can begin utilizing them as a part of your current trading strategy today. In this article, I will go over the 1) basics and 2) intermediate support and resistance review and application.
The Most Comprehensive Article On Support and Resistance Online
1) THE BASICS
Yesterday’s High and Low
Numerous traders trading on day-by-day basis will use certain pivot points/levels given the high or low of the previous session. These levels are noteworthy for day-traders and long-term traders alike. The rules that are applied to find out those levels are the same, but they are used differently. That is what makes trading challenging and also that is why trading is not an exact science.
These levels are anything but difficult to apply to your chart. At the end of the previous day or the beginning of the present trading session just take a ruler and draw a straight line at the session’s high and another one at the session’s low. Your drawing should look like the one below:
Some traders prefer to use the candle’s close for reference, but from my experience (as you will see later), lows and highs of the candle are more significant and carry more weight when deciding where to place support and resistance levels. The candle’s close is important when it comes to defining the support/resistance zones, as you will again see later, as well.
Overnight Range/Opening Range
The distance between support and resistance is the difference between the high and low values set after candle’s formation. For day-traders, this interval could be every hour and for longer-term traders this interval could be weekly or monthly charts. As you would have rightly guessed already, the longer the timeframe, the more accurate the support and resistance lines are.
SUPPORT
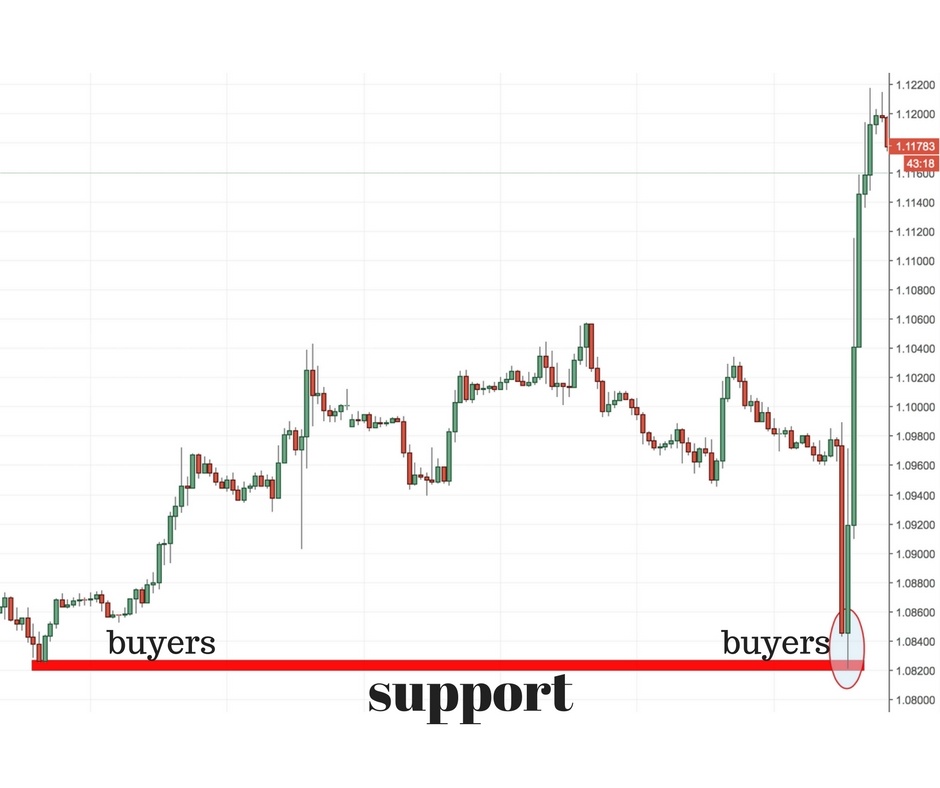
Support is the level at which demand is strong enough so that price does not go lower. The logic behind that is that as the price goes lower, it becomes cheaper and more alluring for market participants to buy. By the time that price is at the support, supply will overcome demand and the price will bounce up and go higher. Have a look at the chart below for a better visualisation:
Support will at times not hold the price and fail. At these moments, the previous levels are not strong enough to prevent the price from falling. At these moments, the willingness to buy is lower and more sellers emerge to drive price lower.
RESISTANCE
Resistance is the opposite of support. It is the level at which sellers are hesitant to continue buying, because it is too expensive already. The logic says that as buyers become more hesitant to buy, sellers come into play and push the price lower. Here is the place to insert our next chart:
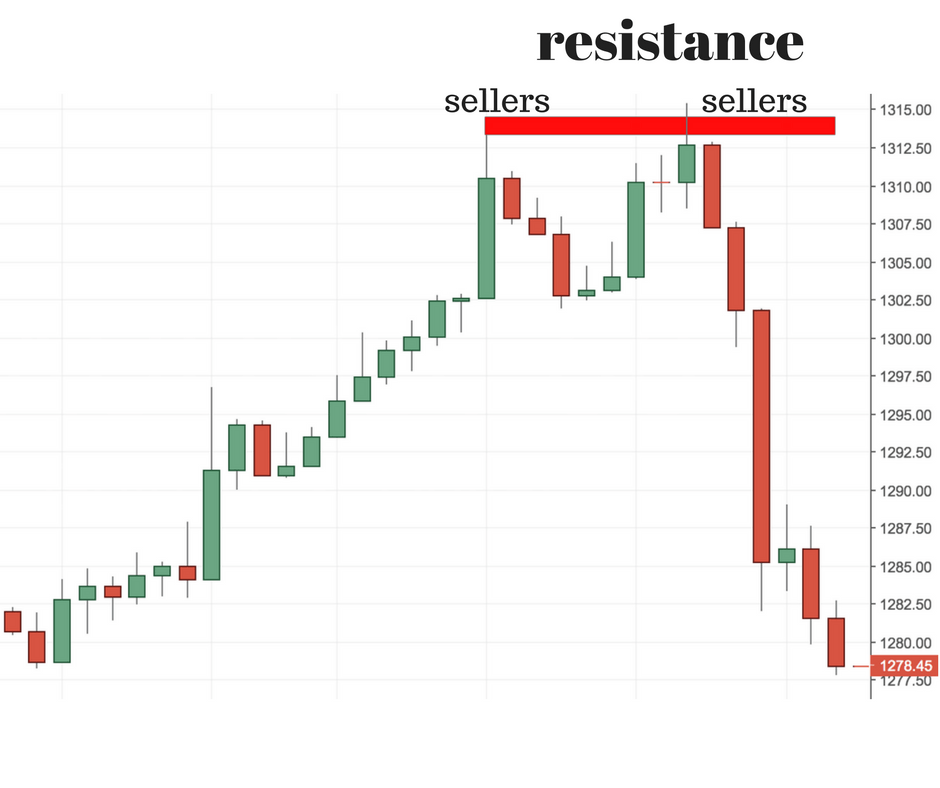
Resistance does not always hold, though. At such moments, market participants are willing to pay even more and are pushing price higher until a new equilibrium is found. Once the resistance is broken, another resistance level is formed at which new sellers are established.
SUPPORT AND RESISTANCE BREAKOUTS ILLUSTRATION
To better understand this process of support and resistance breakouts, we can use the following illustration. Let’s imagine that price moves inside boxes, where support and resistance are the horizontal lines:
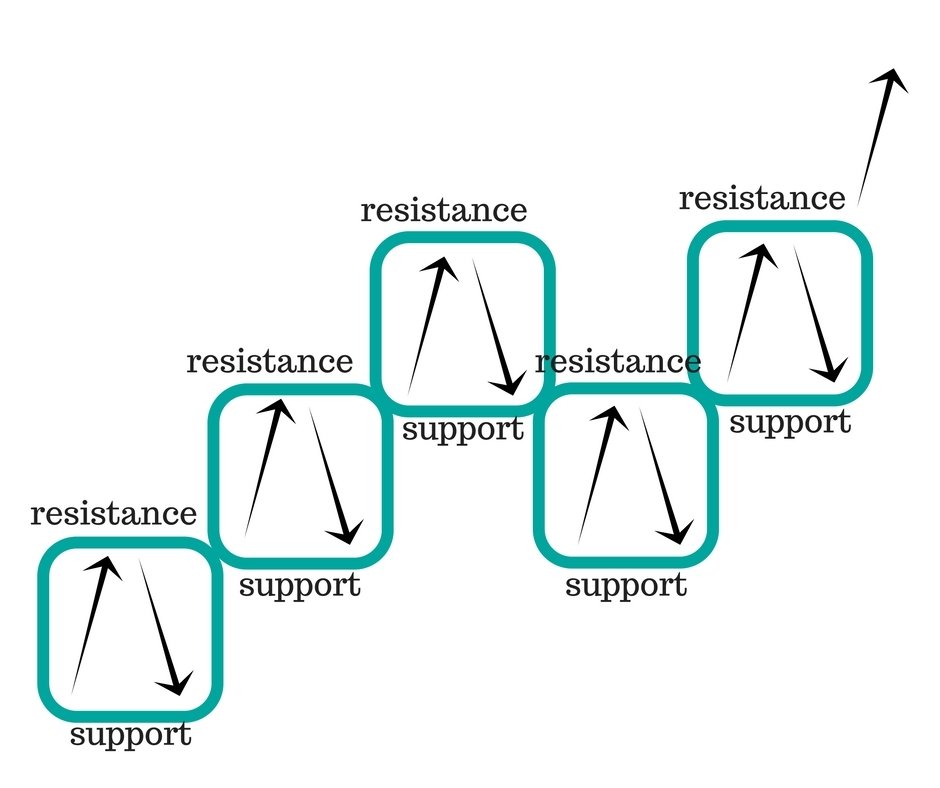
The explanation is simple- a break above resistance shows the unwillingness of sellers to continue selling. At this moment new buyers emerge and take the price to a new equilibrium level or new resistance level. At this stage the process is repeated and so on and so forth. So basically, you can imagine price moving in a series of boxes where each ceiling is the “resistance” and each bottom of the box its “support”.
METHODS TO ESTABLISH SUPPORT AND RESISTANCE
As I have written above, traders do usually use different levels for support and resistance. These are established by connecting the highs/lows of the previous session(s). Some traders prefer to connect instead of the high/lows the close of the candle. From my experience this does work as well, but the highs/lows is where the extreme levels are and where the real resistance/support levels can be found. If you break down each daily support and resistance into its building blocks, you will come up to the same conclusion. In other words- each Daily candlestick is build from the candles with lower timeframes. If you look really deep into price action, you will end up finding that the high/low of the daily candle is the close of a candle from a lower timeframe. I.e. every daily high/low value is the close of a lower timeframe’s close value. That’s the reason why I find every candle’s high/low to be more accurate than its close value.
SUPPORT AND RESISTANCE ZONES
As I have already outlined, technical analysis is not an exact science and that cannot be more true for support and resistance zones. These are similar to support/resistance lines, but encompass a larger area on the charts. Have a look at the example below before we continue with the explanation:
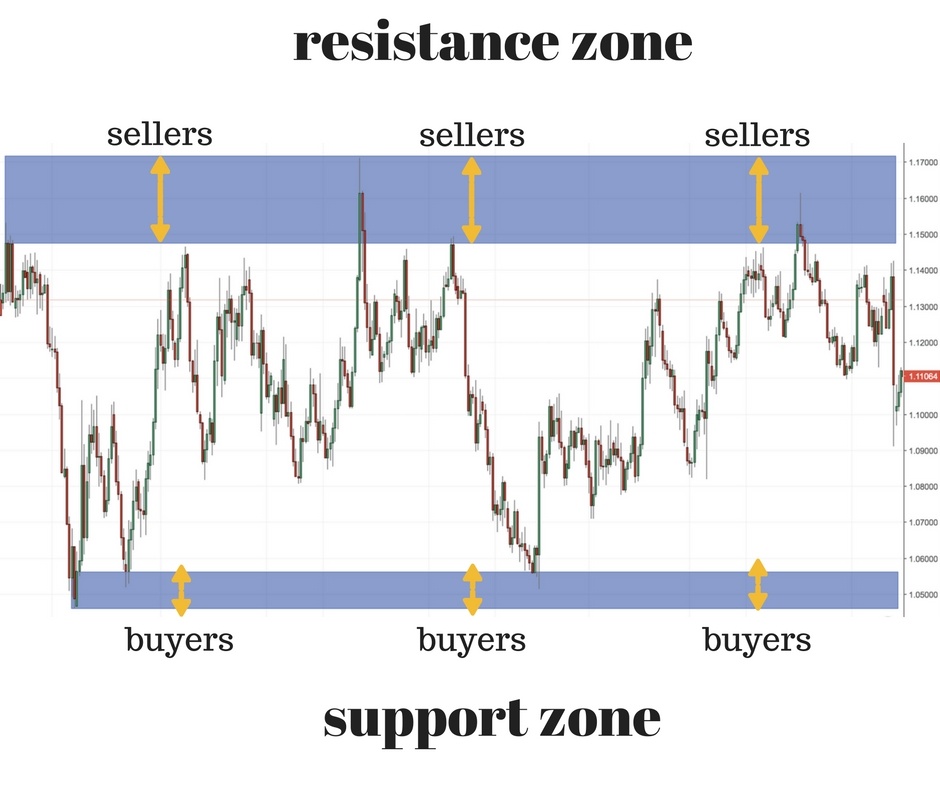
Just like the support and resistance lines, support and resistance zones are a magnet for buyers and sellers. This is an area of active exchange of contracts and an area full of stop and limit orders. This is also an area full of standing orders. Active traders as well as passive traders are looking at this area with an increased interest. This is a place where demand meets supply and price is in an equilibrium state. The same strategies are applied on support and resistance zones as on support and resistance lines. In the mind of the trader, these are just about the same but much bigger areas. Obviously, one should allow for a bigger margin for error when trading zones as opposed to single lines. On the other side, support and resistance zones are less prone to mistakes.
SUPPORT INTO RESISTANCE
Another very prominent feature of support and resistance is that support can turn into resistance and the other way around. Resistance is already a place where a lot of sellers are concentrated. Once it is broken, it has the feature to turn into support. This is best illustrated by the example below:
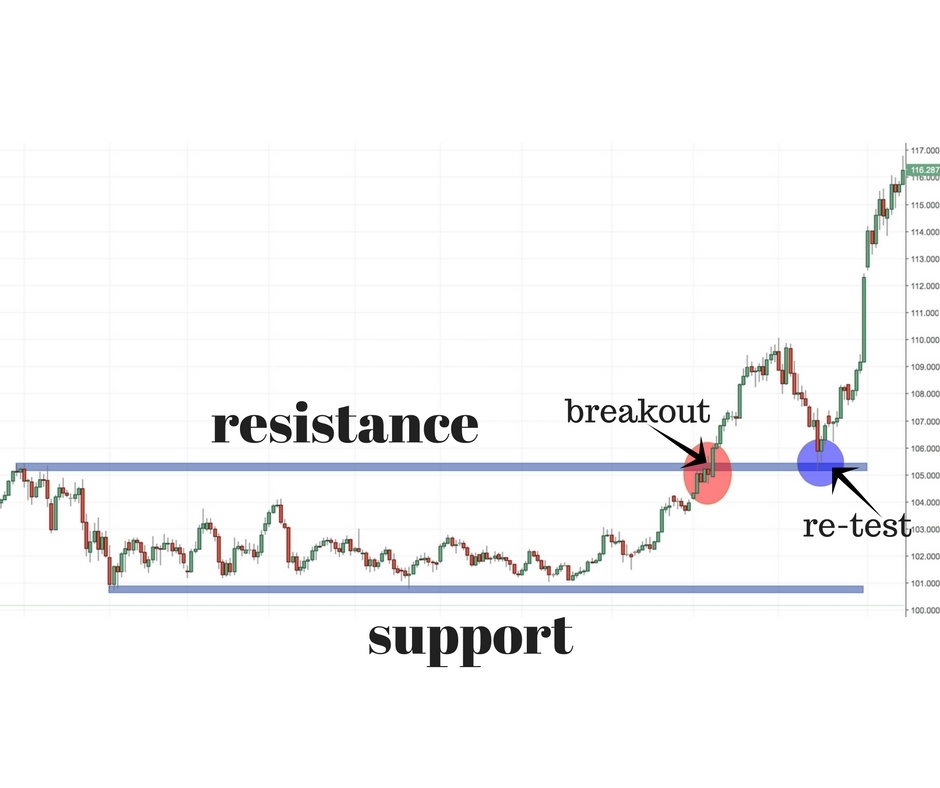
The rule says that once a resistance area has been broken, it turns into a support level. As you can see from the chart below, that is what happened- we had a resistance breakout and then a re-test. That is where the new equilibrium was set and where a change of supply and demand takes place.
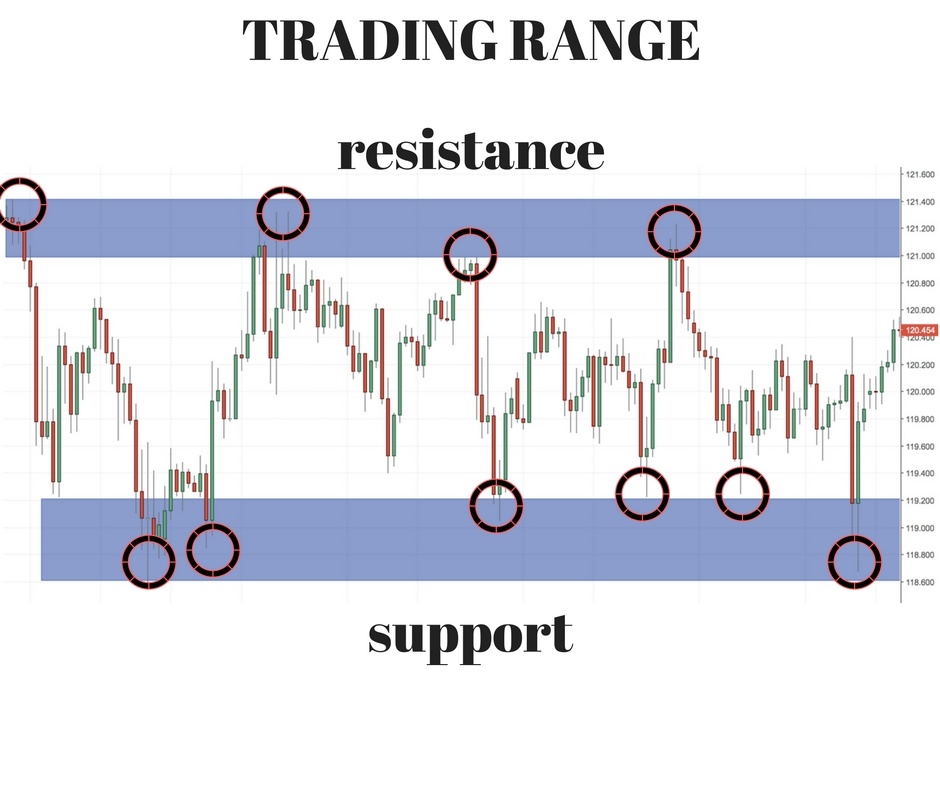
TRADING RANGE
A Trading range is the place where price navigates between support and resistance. These are places of relatively low volatility and places where price is waiting for a fundamental reason to make a new high/low. When the price is locked in a trading range, traders can take advantage of the predictability of price’s movement (as long as there is no fundamental reason for it to break this range). A break above is a victory for the bulls and a break below- for the bears. An example of a trading range is given below:
DIAGONAL TRADING CHANNELS
Another support/resistance strategy that is used by a lot of traders is the diagonal trading channels. Personally not my favourite, but believe that I should have covered it here, since this is the most comprehensive support and resistance article online. The way it works is the same as the trading range with the only difference being the slope of the range. The majority of traders (excluding me) like to use diagonal lines. They find them really helpful in analysing the next move in a certain security. In the example below, you can see this diagonal channel in action:
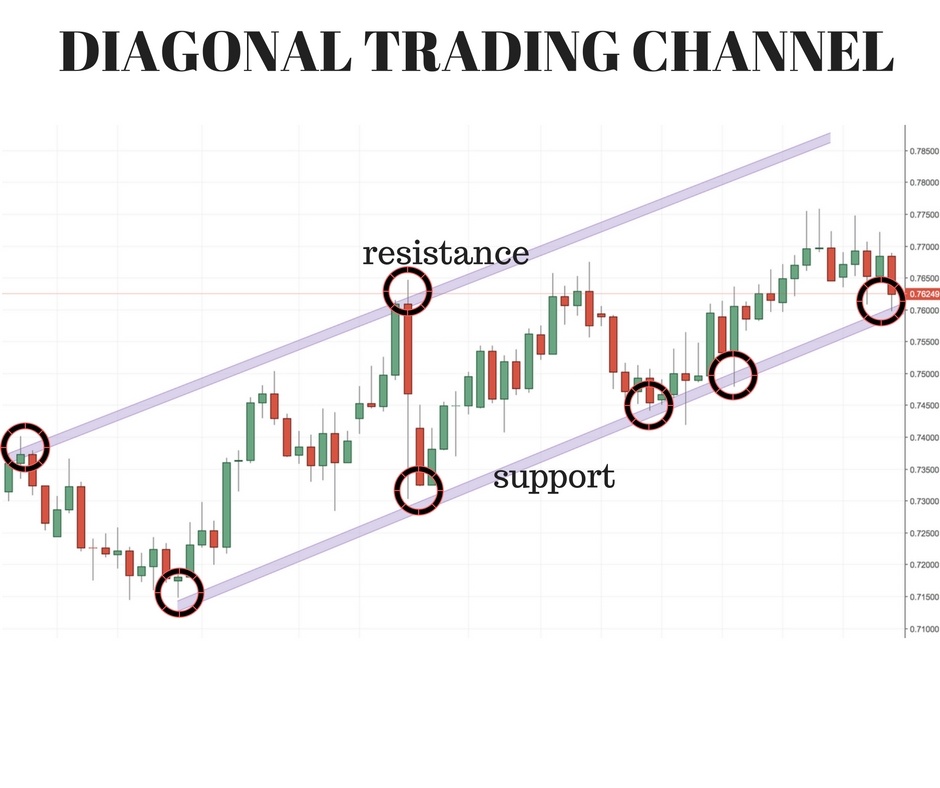
The way it is used is the same as the trading range- traders buy when price touches the support line and sell when it touches the resistance line. Personally I don’t like using diagonal trading channels is because they are too subjective. That is why I prefer to stick with simple support and resistance lines and try to work with them by looking into the lower timeframes.
The Most Comprehensive Article On Support and Resistance Online
2) ADVANCED TECHNIQUES
Support and Resistance in Combination with Lower Timeframes
In this part of the article we are moving from theory to practice. I would like to reveal my way of using support and resistance levels. It does not mean that this is the right way or the only way, but it will definitely show you a unique trading perspective. I am going to reveal my way of finding support and resistance one level deeper.
Using only one timeframe as a reference for finding support and resistance levels might not be enough. I am looking to utilise a few different timeframes in my daily support and resistance analysis.I always start with applying the rules on a Daily timeframe first. I am looking for the best place to enter in a trade from a Daily perspective. Once I spot a good level, I am going to a lower timeframe. 4 Hours is a great timeframe to get even more precise entry. I am looking for the price to form a new low and then going to even a lower timeframe. Here is an example of how 4Hour chart looks like when I have spotted support level on a Daily timeframe. Have a look at the 4Hour chart below:
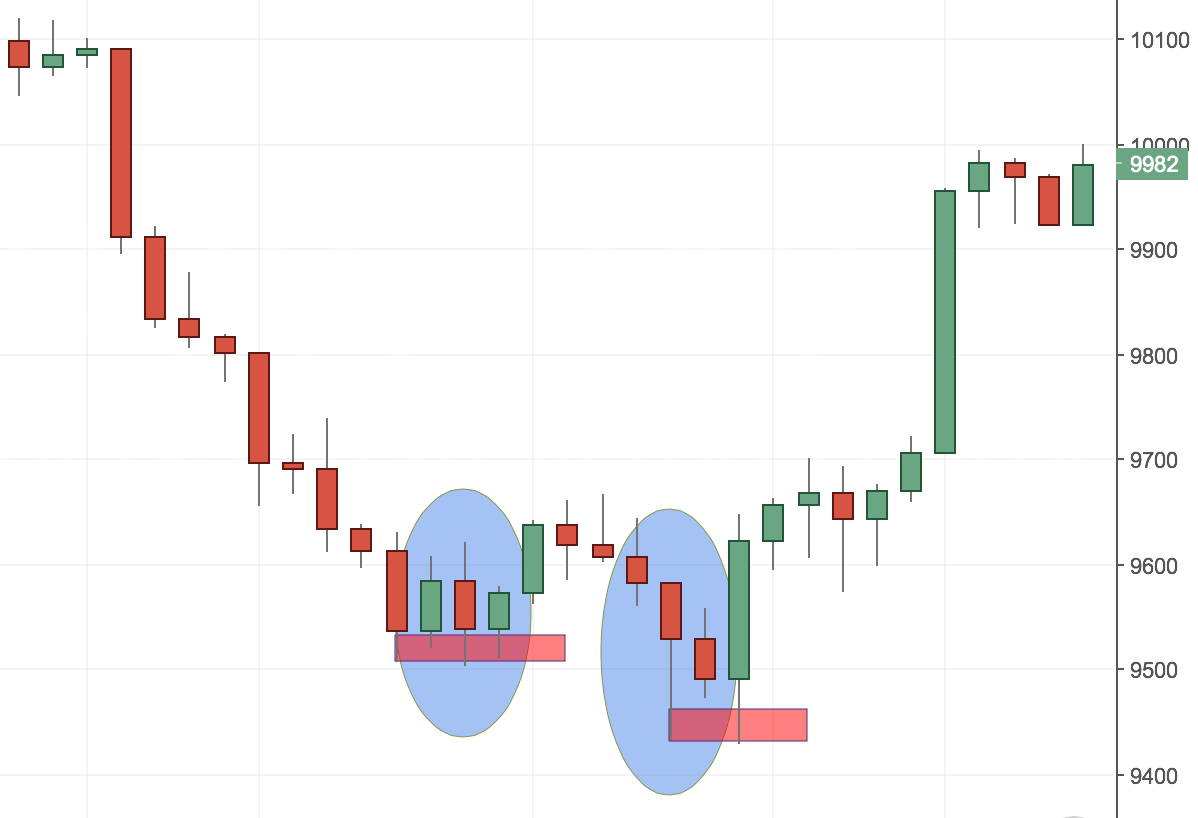
The third timeframe I am checking for a confirmation is the 5 minute chart. For a lot of you that might seem crazy (or absolutely insane), but you NEED to notice that I am only using this timeframe WHEN AND ONLY IF the price is coming close to a major support or resistance level on the DAILY timeframe. What I have noticed is that on this timeframe, I can see a very discernible pattern that forms almost every time. It is a low/high level followed by a new low/high. There are a few variations of this pattern, but most of the times it looks like a small double bottom/double top pattern on the chart.
The charts below show a few different variations of a 5 minute double bottom. It will show as a bearish/bullish rejection(the wick of the candle bar) on the longer-term timeframes. That is where the most orders will be located and that is where I am usually looking to enter into a low-risk trade. In my full-time trading strategy, I am using quite a few other methodologies that are helping me with reducing the risk and increasing the profitability. The purpose of this article is to just show you a different way you can use support and resistance and enter in a low-risk trade. Here are the 5 minute charts that help me choose a very precise entry:
-636088285067611412.png)
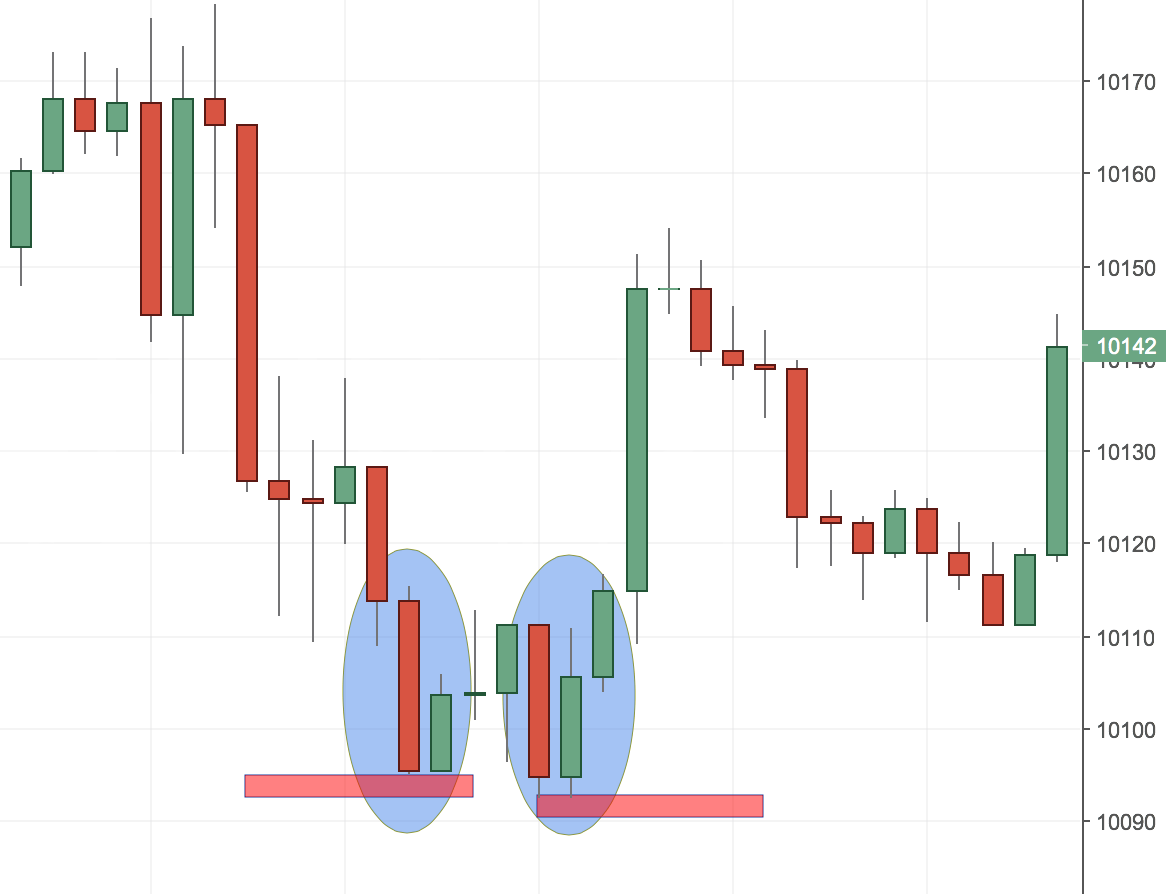
We are not living in a perfect world, but I have noticed that confirming with the lower timeframes is a very precise method to get into a trade. As everything else, this is not a holy grail “bullet-proof” way to use support and resistance profitably. As any other method this one has its own drawbacks and should be tested individually. That is why I do use it in conjunction with my trading strategy. Some of the weak points of support and resistance are that from time to time (around 10-15% of the time) you do have a breakout. In other words, the support and resistance levels do not hold and invalidate the level. At other times, price just stops a little bit before support/resistance and changes direction without touching the level.
It is wise to know use support zones at times (as described above) and use them in conjunction with support/resistance levels. There are various ways you can improve your knowledge on the application of support and resistance, but the best way is experiencing yourself and trading on a Demo account first. As a profitable trader, the most important thing you should be aware of is that losing is part of the game. That is why I believe that losing small amounts from time to time is healthy. It keeps you awake and alert and most important of all- prevents you from being overconfident.
CONCLUSION-The Most Comprehensive Article On Support and Resistance Online
In this article (hopefully the most comprehensive article on support and resistance online) I’ve introduced you to the basics of support and resistance. I walked you through support and resistance lines, support and resistance zones and channels; I talked about support and resistance breakouts as well as the way I apply support and resistance in real time. The purpose of this article was not to be only informative, but also practical. Although a lot of traders are using only support and resistance when taking trading decisions, I believe that they are best used in conjunction with other trading tool. Price action is one such tool, but not the only one. You should use what works for you and stick to one strategy, when it has proven with time that it works.
Happy Trading,
This material is written for educational purposes only. By no means do any of its contents recommend, advocate or urge the buying, selling or holding of any financial instrument whatsoever. Trading and Investing involves high levels of risk. The author expresses personal opinions and will not assume any responsibility whatsoever for the actions of the reader. The author may or may not have positions in Financial Instruments discussed in this newsletter. Future results can be dramatically different from the opinions expressed herein. Past performance does not guarantee future results.
Editors’ Picks

EUR/USD extends its optimism past 1.1900
EUR/USD retains a firm underlying bid, surpassing the 1.1900 mark as the NA session draws to a close on Monday. The pair’s persistent uptrend comes as the US Dollar remains on the defensive, with traders staying cautious ahead of upcoming US NFP prints and CPI data.

GBP/USD tilts bullish as markets barrel toward mid-week NFP print
GBP/USD is holding a broader bullish structure on the daily chart, with price trading well above the 50 Exponential Moving Average at 1.3507 and the 200 EMA at 1.3310, confirming the intermediate uptrend that has been in place since the November 2025 low near 1.2300.

USD/JPY slumps below 156.00 as Japanese Yen strengthens after Takaichi's landslide victory
The USD/JPY pair tumbles to near 155.90 during the early Asian session on Tuesday. The Japanese Yen strengthens against the US Dollar after Japanese Prime Minister Sanae Takaichi led the ruling Liberal Democratic Party to a historic landslide win. Traders braced for key US economic data that could offer more clues on the Federal Reserve's monetary policy.
Editors’ Picks

AUD/USD taps three-year highs on broad US Dollar weakness
AUD/USD is trading near three-year highs after a strong break above the 0.7000 psychological level for the first time since February 2023, supported by the Reserve Bank of Australia's surprise 25 basis point rate hike to 3.85% at its February meeting. The daily chart shows the pair in a well-defined uptrend, holding above both the 50-day Exponential Moving Average near 0.6970 and the 200-day EMA around 0.6700.

Gold pushes back above $5,000
The daily chart shows spot Gold in a parabolic uptrend that accelerated sharply from the $4,600 area in late January, printing a record high at $5,598.25 before a violent reversal erased nearly $1,000 in value during the final days of the month.
USD/JPY slumps below 156.00 as Japanese Yen strengthens after Takaichi's landslide victory
The USD/JPY pair tumbles to near 155.90 during the early Asian session on Tuesday. The Japanese Yen strengthens against the US Dollar after Japanese Prime Minister Sanae Takaichi led the ruling Liberal Democratic Party to a historic landslide win. Traders braced for key US economic data that could offer more clues on the Federal Reserve's monetary policy.

Litecoin eyes $50 as heavy losses weigh on investors
Following a strong downtrend across the crypto market over the past week, Litecoin holders are under immense pressure. The Bitcoin fork has trimmed about $1.81 billion from its market capitalization since the beginning of the year, sending it below the top 20 cryptos by market cap.

Japanese PM Takaichi nabs unprecedented victory – US data eyed this week
I do not think I would be exaggerating to say that Japanese Prime Minister Sanae Takaichi’s snap general election gamble paid off over the weekend – and then some. This secured the Liberal Democratic Party (LDP) an unprecedented mandate just three months into her tenure.
RECOMMENDED LESSONS
Making money in forex is easy if you know how the bankers trade!
I’m often mystified in my educational forex articles why so many traders struggle to make consistent money out of forex trading. The answer has more to do with what they don’t know than what they do know. After working in investment banks for 20 years many of which were as a Chief trader its second knowledge how to extract cash out of the market.
5 Forex News Events You Need To Know
In the fast moving world of currency markets where huge moves can seemingly come from nowhere, it is extremely important for new traders to learn about the various economic indicators and forex news events and releases that shape the markets. Indeed, quickly getting a handle on which data to look out for, what it means, and how to trade it can see new traders quickly become far more profitable and sets up the road to long term success.
Top 10 Chart Patterns Every Trader Should Know
Chart patterns are one of the most effective trading tools for a trader. They are pure price-action, and form on the basis of underlying buying and selling pressure. Chart patterns have a proven track-record, and traders use them to identify continuation or reversal signals, to open positions and identify price targets.
7 Ways to Avoid Forex Scams
The forex industry is recently seeing more and more scams. Here are 7 ways to avoid losing your money in such scams: Forex scams are becoming frequent. Michael Greenberg reports on luxurious expenses, including a submarine bought from the money taken from forex traders. Here’s another report of a forex fraud. So, how can we avoid falling in such forex scams?
What Are the 10 Fatal Mistakes Traders Make
Trading is exciting. Trading is hard. Trading is extremely hard. Some say that it takes more than 10,000 hours to master. Others believe that trading is the way to quick riches. They might be both wrong. What is important to know that no matter how experienced you are, mistakes will be part of the trading process.
The challenge: Timing the market and trader psychology
Successful trading often comes down to timing – entering and exiting trades at the right moments. Yet timing the market is notoriously difficult, largely because human psychology can derail even the best plans. Two powerful emotions in particular – fear and greed – tend to drive trading decisions off course.