![]() Gabe Velázquez
Gabe Velázquez
Online Trading Academy
In the last 18 years, one company has not only revolutionized how we buy, store and listen to music but has also been one of the most innovative in showing us new ways we communicate and interact with our cell phones. And talk about customer loyalty? There are only a handful of companies throughout history that can claim such fierce devotion to their products. We are, of course, referring to Apple Corporation.
So why am I writing about Apple in an article dedicated to futures trading? To some of you, it may be already evident that Apple influences the movement of not only the Nasdaq but the broader market in general, and for the rest of you, this piece may elucidate you into to the Why of this phenomenon.
As I write this article, news has come across the tape that Apple Corporation is guiding their earnings lower for the first quarter of 2019. They’re citing the shortfall due to the slowing economy in China. If you’re wondering how the Nasdaq futures are reacting: the chart below answers that question.
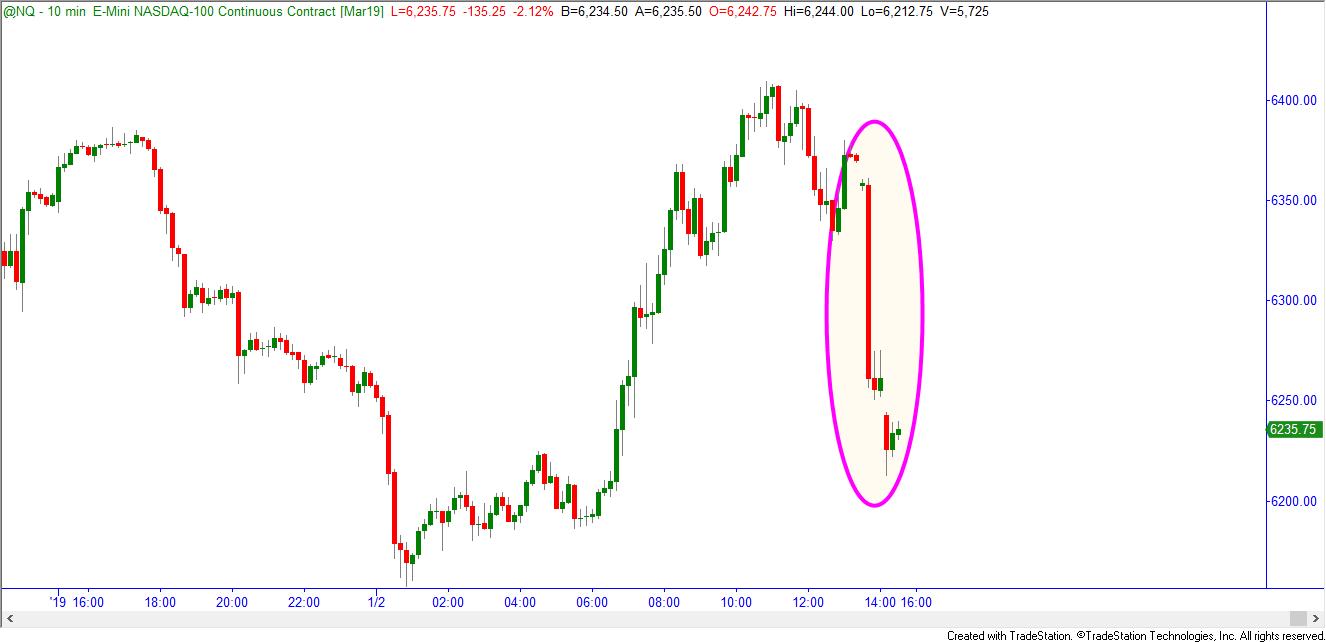
To understand this reaction, let’s start with the basics on how the stock indexes are constructed. The four major stock indexes are the Nasdaq 100, S&P 500, Dow Jones Industrial Average and the Russell 2,000 small cap Index. Coincidentally, Apple is a big component of the first three of these indexes.
Indexes are the aggregation of all the stocks that are included in an index. These stocks are then added together based on their weighting and divided by a specific diviser to end up with a number (the Index price). So as an example, the Nasdaq 100 Index is taking the 100 largest companies in the Nasdaq market to assemble this particular Index. Most of the major equity indexes are cap weighted with the only exception being the Dow Jones Industrial average, which is price weighted. The Nasdaq, for example, is a Cap weighted index. Therefore, the bigger the stock’s market capitalization, the bigger the influence that stock will have on the price movement of its corresponding index. When referring to the market cap of a company this is simply the price of the stock multiplied by the shares outstanding. As an example of market capitalization, let’s say a company has 100 million shares outstanding and they’re currently priced at $10.00 per share. The stock’s market cap is 1 billion.
The meteoric rise of Apple since 2009 has vaulted it to being one of the most valuable (in terms of market capitalization) companies in the world, surpassing Exxon Mobil and Microsoft which previously held that distinction. This, in turn, makes it almost 20% of the weighting of the Nasdaq 100 Index. As you might have guessed, this fact makes it one of the most influential stocks in the Nasdaq and S&P 500 index. This pull was clearly felt immediately after Apple guided lower at the time of this writing. This also has had a huge ripple effect across the currencies and other related markets this Wednesday afternoon.
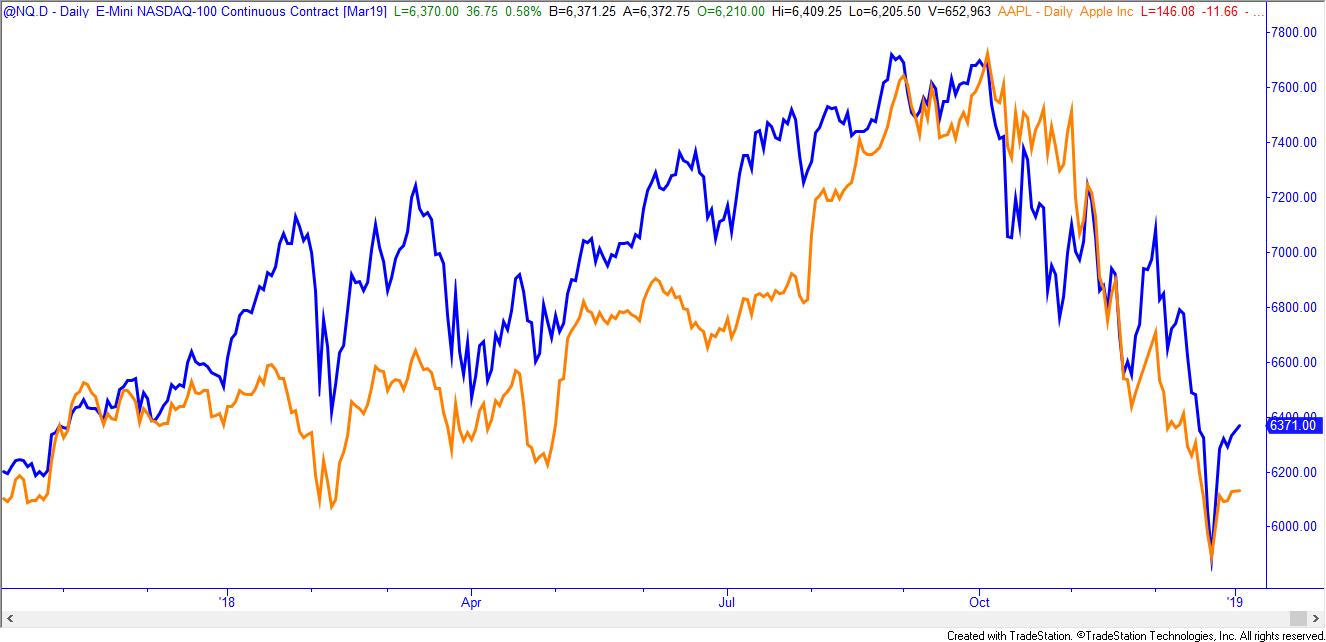
To illustrate the correlation between Apple shares and the Nasdaq 100 E-mini futures, I have superimposed the chart of Apple (the orange line) on top of that of the Nasdaq 100 futures (blue line). In it we see the strong correlation between the two.
The question for traders going forward is if the inextricable link between Apple and the markets will break anytime soon. The answer is, probably not, and if that’s the case, how does this determine the outlook for the overall stock market going forward?
Apple shares have sold off along with the board market since September, and during that pullback created supply levels that have not been tested. There are also several gaps that were created after the news of the lower guidance. We will be looking at some of these levels for guidance as to where to be shorting both the stock and the Nasdaq e-mini futures. There may also be possible buying opportunities at lower prices in upcoming days at fresh demand levels. So, for now, Apple will continue to be a leadership stock and we must keep an eye on it as the supply and demand levels that form will help us gauge where it might reverse in the near term. One caveat: never let a great company (which undeniably Apple is), or the affinity for their products, cloud your judgment as to when to short the stock or take profits when you have them. Profits, after all, are our main objective when trading any markets. To that end, avoid falling in love with a company or its products if you want to produce long term consistent profits.
Until next time, I hope everyone has a wonderful week.
Read the original article here - The Apple Influence on Index Futures
This content is intended to provide educational information only. This information should not be construed as individual or customized legal, tax, financial or investment services. As each individual's situation is unique, a qualified professional should be consulted before making legal, tax, financial and investment decisions. The educational information provided in this article does not comprise any course or a part of any course that may be used as an educational credit for any certification purpose and will not prepare any User to be accredited for any licenses in any industry and will not prepare any User to get a job. Reproduced by permission from OTAcademy.com click here for Terms of Use: https://www.otacademy.com/about/terms
Editors’ Picks

EUR/USD turns negative near 1.1850
EUR/USD has given up its earlier intraday gains on Thursday and is now struggling to hold above the 1.1850 area. The US Dollar is finding renewed support from a pick-up in risk aversion, while fresh market chatter suggesting Russia could be considering a return to the US Dollar system is also lending the Greenback an extra boost.

GBP/USD change course, nears 1.3600
GBP/USD gives away its daily gains and recedes toward the low-1.3600s on Thursday. Indeed, Cable now struggles to regain some upside traction on the back of the sudden bout of buying interest in the Greenback. In the meantime, investors continue to assess a string of underwhelming UK data releases released earlier in the day.

USD/JPY consolidates around 153.00 favoured by lower Fed easing bets
USD/JPY steadies around 153.00 after hitting two-week lows at 152.25. A strong US Nonfarm Payrolls report provided some support for the US Dollar on Wednesday. The Yen remains on track for a 2.6% weekly rally, boosted by Takaichi's victory at Sunday's elections.
Editors’ Picks

Gold plunges on sudden US Dollar demand
Gold drops markedly on Thursday, challenging the $4,900 mark per troy ounce following a firm bounce in the US Dollar and amid a steep sell-off on Wall Street, with losses led by the tech and housing sectors.
EUR/USD turns negative near 1.1850
EUR/USD has given up its earlier intraday gains on Thursday and is now struggling to hold above the 1.1850 area. The US Dollar is finding renewed support from a pick-up in risk aversion, while fresh market chatter suggesting Russia could be considering a return to the US Dollar system is also lending the Greenback an extra boost.
GBP/USD change course, nears 1.3600
GBP/USD gives away its daily gains and recedes toward the low-1.3600s on Thursday. Indeed, Cable now struggles to regain some upside traction on the back of the sudden bout of buying interest in the Greenback. In the meantime, investors continue to assess a string of underwhelming UK data releases released earlier in the day.

LayerZero Price Forecast: ZRO steadies as markets digest Zero blockchain announcement
LayerZero (ZRO) trades above $2.00 at press time on Thursday, holding steady after a 17% rebound the previous day, which aligned with the public announcement of the Zero blockchain and Cathie Wood joining the advisory board.

A tale of two labour markets: Headline strength masks underlying weakness
Undoubtedly, yesterday’s delayed US January jobs report delivered a strong headline – one that surpassed most estimates. However, optimism quickly faded amid sobering benchmark revisions.
RECOMMENDED LESSONS
Making money in forex is easy if you know how the bankers trade!
I’m often mystified in my educational forex articles why so many traders struggle to make consistent money out of forex trading. The answer has more to do with what they don’t know than what they do know. After working in investment banks for 20 years many of which were as a Chief trader its second knowledge how to extract cash out of the market.
5 Forex News Events You Need To Know
In the fast moving world of currency markets where huge moves can seemingly come from nowhere, it is extremely important for new traders to learn about the various economic indicators and forex news events and releases that shape the markets. Indeed, quickly getting a handle on which data to look out for, what it means, and how to trade it can see new traders quickly become far more profitable and sets up the road to long term success.
Top 10 Chart Patterns Every Trader Should Know
Chart patterns are one of the most effective trading tools for a trader. They are pure price-action, and form on the basis of underlying buying and selling pressure. Chart patterns have a proven track-record, and traders use them to identify continuation or reversal signals, to open positions and identify price targets.
7 Ways to Avoid Forex Scams
The forex industry is recently seeing more and more scams. Here are 7 ways to avoid losing your money in such scams: Forex scams are becoming frequent. Michael Greenberg reports on luxurious expenses, including a submarine bought from the money taken from forex traders. Here’s another report of a forex fraud. So, how can we avoid falling in such forex scams?
What Are the 10 Fatal Mistakes Traders Make
Trading is exciting. Trading is hard. Trading is extremely hard. Some say that it takes more than 10,000 hours to master. Others believe that trading is the way to quick riches. They might be both wrong. What is important to know that no matter how experienced you are, mistakes will be part of the trading process.
The challenge: Timing the market and trader psychology
Successful trading often comes down to timing – entering and exiting trades at the right moments. Yet timing the market is notoriously difficult, largely because human psychology can derail even the best plans. Two powerful emotions in particular – fear and greed – tend to drive trading decisions off course.