![]() Elliott Wave International Analysts Team
Elliott Wave International Analysts Team
Elliott Wave International
Stock market history shows that when the Elliott wave model of stock market patterns and market bullish/bearish sentiment indicators are aligned, you have the basis for a high-confidence forecast.
That was the exact situation back in January, right before the stock market's jarring sell-off, from which stocks still haven't quite recovered.
Let's start with a brief review of Elliott Wave International's analysis of the DJIA's Elliott wave chart pattern. On Jan. 5, the Elliott Wave Financial Forecast noted:
The wave structure of the advance looks mature...
Mature, as in -- we could clearly see a 5-wave price pattern on DJIA charts. When a fifth wave ends, a move in the opposite direction begins.
Indeed, just three weeks later, the DJIA hit a peak of 26,617. As you'll recall, a period of wild volatility shortly followed.
What also helped the Elliott Wave Financial Forecast make the call was the extreme bullish reading in the stock market's sentiment measures, which supported the view that the DJIA's "advance looks mature":
Sentiment is strikingly suited for the end of an advance.
Realize that sentiment is "suited for the end of an advance" when it reaches an extreme bullish reading. In a nutshell, when everyone is bullish, everyone has already bought, so the price cannot move any higher. The opposite is true at the end of a prolonged downturn.
Now, let's proceed with the details of key sentiment measures from around the start of 2018.
This chart and commentary is also from the January Financial Forecast (Elliott wave labels available to subscribers):
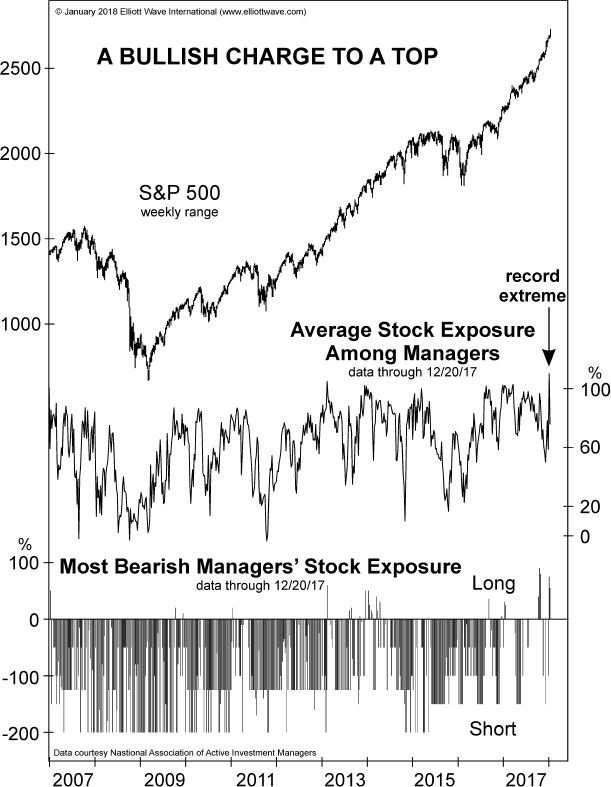
The chart shows the National Association of Active Investment Managers' Equity Exposure index. NAAIM's index hit a record high of 109.4 the week of December 11. Since 100 equates to a 100% invested position, this means that NAAIM portfolios were leveraged long to a record degree. As noted above, the extreme use of leverage represents a heightened state of expectation, as it means that buyers of stock are so confident in an advance that they are willing to borrow money to bet on rising share prices. [Emphasis added.]
Another January Financial Forecast chart with accompanying commentary sheds more light on the prevailing sentiment just before the DJIA's January 26 peak:
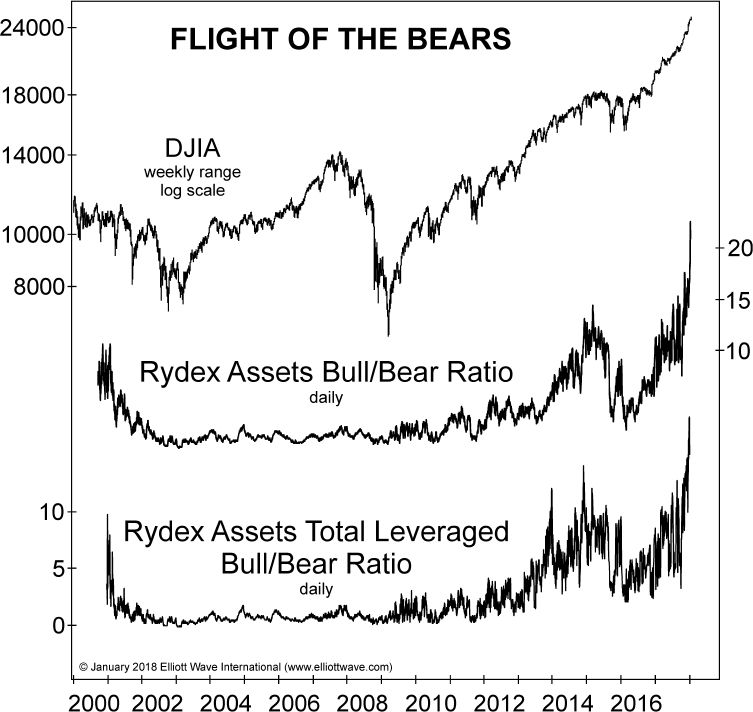
Last month we showed a chart of the Rydex Total Leveraged Bull/Bear Ratio through November. With leveraged-long Rydex assets more than 14.4 times as great as leveraged-short assets, the ratio tied the prior record extreme registered in late 2014. In December, the ratio shattered that record with a surge to 18.6, a boost of 29% from the November high, as shown by the lower graph on the chart. The middle line on the graph shows an even more breathtaking spike in Rydex's Bull/Bear Ratio (unleveraged). The ratio jumped to 22 on December 29, easily the most extreme reading in the 16-year history of the data. [Emphasis added.]
So, as you might imagine, our Elliott Wave Financial Forecast editors were not surprised by the DJIA's peak (26,617) just three weeks later.
Regarding the details of EWI's technical analysis at the time, we encourage you to see them for yourself in a new free report that remains relevant now (see below).
The January setup will repeat itself, and having the knowledge of what to look for can help you avoid getting caught unprepared -- as well as capturing opportunities that every market reversal presents.
Get more financial insights like these -- 100% free. Just follow this link
Elliott Wave International does not provide investment advice. All rights reserved.
Editors’ Picks

EUR/USD trims gains, back below 1.1800
EUR/USD now loses some upside momentum, returning to the area below the 1.1800 support as the Greenback manages to regain some composure following the SCOTUS-led pullback earlier in the session.

GBP/USD off highs, recedes to the sub-1.3500 area
Following earlier highs north of 1.3500 the figure, GBP/USD now faces some renewed downside pressure, revisiting the 1.3490 zone as the US Dollar manages to regain some upside impulse in the latter part of the NA session on Friday.

USD/JPY sticks to gains above 155.00, over one-week top ahead of US data
The USD/JPY pair gains positive traction for the third straight day and climbs to over a one-week top, around the 155.35-155.40 region. Data released early today showed that Japan’s key inflation gauge eased to the slowest pace in two years, tempering expectations for an immediate policy tightening by the Bank of Japan.
Editors’ Picks

EUR/USD: US Dollar comeback in the makes? Premium
The US Dollar (USD) stands victorious at the end of another week, with the EUR/USD pair trading near a four-week low of 1.1742, while the USD retains its strength despite some discouraging American data released at the end of the week.

Gold: Escalating geopolitical tensions help limit losses Premium
Gold (XAU/USD) struggled to make a decisive move in either direction this week as it quickly recovered above $5,000 after posting losses on Monday and Tuesday.

GBP/USD: Pound Sterling braces for more pain, as 200-day SMA tested Premium
The Pound Sterling (GBP) crashed to its lowest level in a month against the US Dollar (USD), as critical support levels were breached in a data-packed week.
Bitcoin: No recovery in sight
Bitcoin (BTC) price continues to trade within a range-bound zone, hovering around $67,000 at the time of writing on Friday, and falling slightly so far this week, with no signs of recovery.

US Dollar: Tariffed. Now What? Premium
The US Dollar (USD) reversed its previous week’s decline, managing to stage a meaningful rebound and retesting the area just above the 98.00 barrier when tracked by the US Dollar Index (DXY).
RECOMMENDED LESSONS
Making money in forex is easy if you know how the bankers trade!
I’m often mystified in my educational forex articles why so many traders struggle to make consistent money out of forex trading. The answer has more to do with what they don’t know than what they do know. After working in investment banks for 20 years many of which were as a Chief trader its second knowledge how to extract cash out of the market.
5 Forex News Events You Need To Know
In the fast moving world of currency markets where huge moves can seemingly come from nowhere, it is extremely important for new traders to learn about the various economic indicators and forex news events and releases that shape the markets. Indeed, quickly getting a handle on which data to look out for, what it means, and how to trade it can see new traders quickly become far more profitable and sets up the road to long term success.
Top 10 Chart Patterns Every Trader Should Know
Chart patterns are one of the most effective trading tools for a trader. They are pure price-action, and form on the basis of underlying buying and selling pressure. Chart patterns have a proven track-record, and traders use them to identify continuation or reversal signals, to open positions and identify price targets.
7 Ways to Avoid Forex Scams
The forex industry is recently seeing more and more scams. Here are 7 ways to avoid losing your money in such scams: Forex scams are becoming frequent. Michael Greenberg reports on luxurious expenses, including a submarine bought from the money taken from forex traders. Here’s another report of a forex fraud. So, how can we avoid falling in such forex scams?
What Are the 10 Fatal Mistakes Traders Make
Trading is exciting. Trading is hard. Trading is extremely hard. Some say that it takes more than 10,000 hours to master. Others believe that trading is the way to quick riches. They might be both wrong. What is important to know that no matter how experienced you are, mistakes will be part of the trading process.
The challenge: Timing the market and trader psychology
Successful trading often comes down to timing – entering and exiting trades at the right moments. Yet timing the market is notoriously difficult, largely because human psychology can derail even the best plans. Two powerful emotions in particular – fear and greed – tend to drive trading decisions off course.