Stochastic Definition
What is Stochastic?
I write mostly about price action, candles, support and resistance but have received a lot of requests about a few indicators. Stochastic is the first indicator I want to cover thoroughly. If you are not using indicators in your trading, it is still worth it to know how traders use them. This will expand your understanding of the markets in general. So, what is the definition of Stochastic?
Stochastic- it is an oscillator that is a momentum indicator that is comparing the closing price of a security to the range of its prices over a certain period of time. Seeing nature through the lens of probability theory is what mathematicians call the stochastic view.The word comes from the Greek stochastes, a diviner. It in turn comes from stokhos, a pointed stake used as a target by archers.
Slow Stochastic: Understanding indicators
Breaking it Down
How do you calculate Stochastic? There is a formulae calculating it and it is:
Where:
C = the most recent closing price
L14 = the low of the 14 previous trading sessions
H14 = the highest price traded during the same 14-day period
%K= the current market rate for the currency pair (a.k.a. Fast %K)
%D = 3-period moving average of %K (a.k.a. Slow %D)
The connotation is when the market is in an uptrend, the prices are close to the high; when the market is in a downtrend, the prices are close to the low.
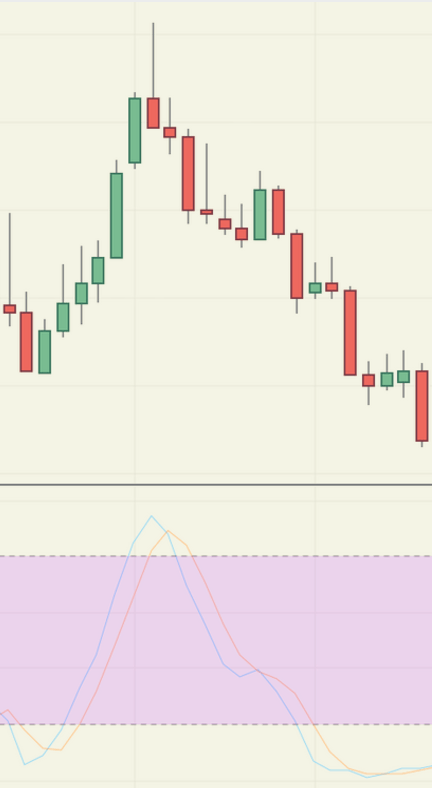
As I wrote before, when the price is in an uptrend, the oscillator is close to its high. As you can see on the example taken from a EURUSD chart above. When the price is in a downtrend, the Stochastic is near its low values as can be seen on the screenshot above.
By definition, Stochastic is measuring the speed or rate of acceleration of a security. In extremely fast markets (as can be seen above) the Stochastic’s angle is sharper. As you can see, the Stochastic is almost vertical. When the price slows down, the indicator is reflecting that change and is steepening out. The default settings of the stochastic are 14 and 5 periods. These readings are the absolute high/low for that period compared to the closing price. Other commonly used parameters for “K” are: 15, 10 or 5 days!
Applications and Much More
Dr. George Lane, a financial analyst, is one of the first to publish on the use of stochastic oscillators to forecast prices. In his own words: “Stochastics measures the momentum of price. If you visualize a rocket going up in the air – before it can turn down, it must slow down. Momentum always changes direction before price.”
As prices move down, the close of the day has a tendency to crowd the lower portion of the daily range. Just before you get to the absolute price low, the market does not have as much push as it did. The closes no longer crowd the bottom of the daily range. Therefore, Stochastics turns up at or before the final price low. Can we use this as an absolute holy grail indicator boding success? As you can imagine, the answer is more complicated than usual. A single indicator should not be used on its own. Traders should be looking for a combination of indicators and confluence of factors before executing a trade. No matter how tempting and simple it sounds to use a single indicator, you should be aware of the dangers that the markets incorporate in their daily gyrations.
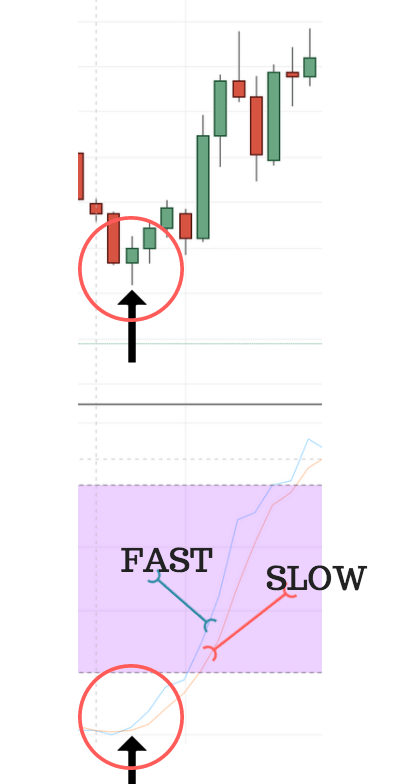
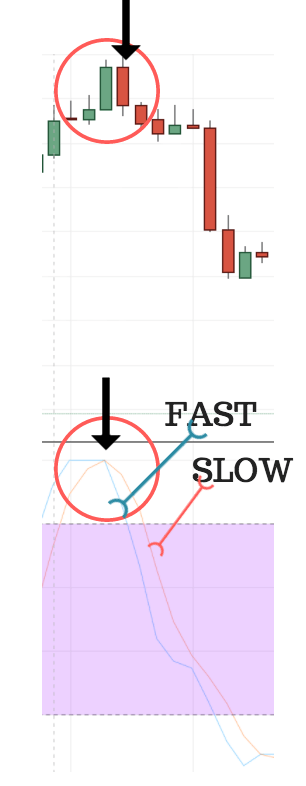
Application #1
-
Bullish Signal: If the Fast K line pierces the slow line from south to north (on the left), we have a bullish signal. Market participants will be buying.
-
Bearish Signal: If the Fast line pierces the slow line from north to south (on the right), we have a bearish signal. Market participants are selling
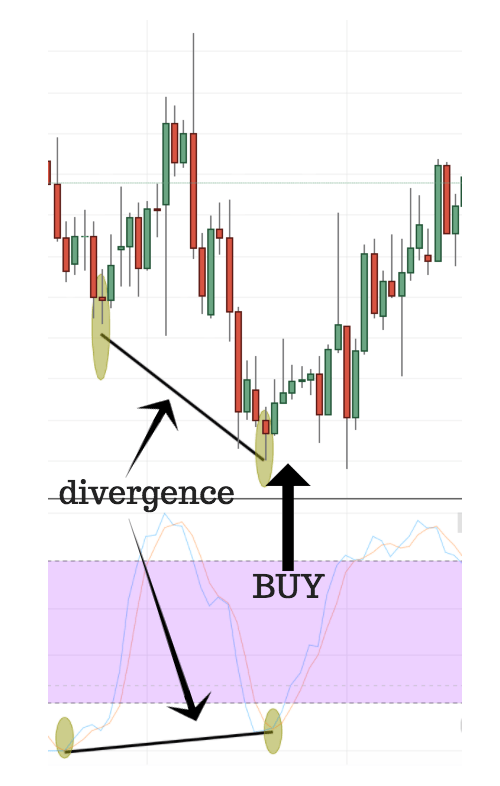
Application #2:
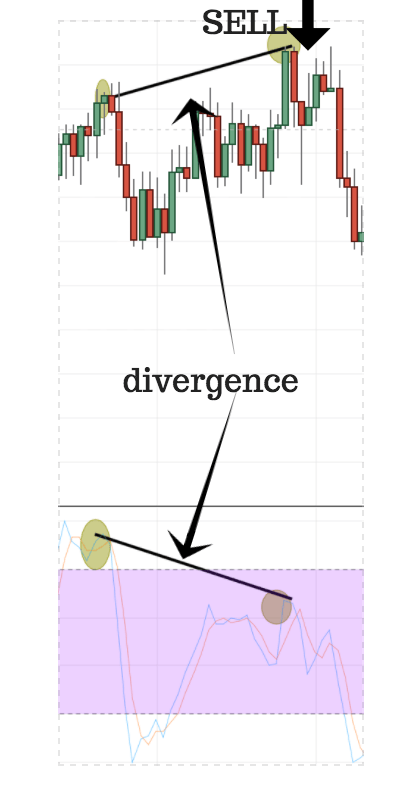
- Positive Divergence: Market participants are looking for a positive divergence when they are looking to buy. The divergence principles with Stochastic are the same as in any other oscillator’s divergence. We are looking for an extreme low level in the oscillator. The price should be making a new low, while the oscillator should be forming a higher low than the previous one. Have a look at the screenshot below:
- Negative Divergence: Stochastic is giving a signal to sell when there is a negative divergence between price and the indicator. Traders are looking for an extreme reading in the indicator. There needs to be a higher high in the price chart corresponding to a lower second high on the indicator. Once this scenario is present, traders are selling by rule.
In general, slowing down of the momentum is accepted by market participants as an exhaustion in the market and therefore change of market direction. It is easier said than done, so you must be extremely careful when taking trades. The general market environment and the macro trends should be taken under consideration. As I said before, Stochastic is a great indicator, but used on its own might lead to losses. Traders should consider using it in combination with other methods or time frames. Price action and support/resistance levels are crucial. Therefore, be extremely careful and check with your other indicators before placing a trade.
Application #3
Alternative Stochastic behaviour: A third way to view the Stochastic indicator is to check when it pops. A “stochastic pop” is an event where price breaks out and keeps on going. This usually occurs in trending markets when the trend is very strong. It is usually interpreted by market participants as a signal to increase position in the way of the trend. Conversely, if you they had a contrarian position open, traders are liquidating it.
Overbought and Oversold Levels
A) Stochastic Overbought Levels

Like other oscillators, Stochastic is deviating between an overbought and an oversold level. An overbought level is defined by price reaching such a level that it is considered that the oscillator has reached its upper bounds. This is usually accompanied by higher volume. The overbought level for Stochastic is 80. Usually this level is considered to be a bearish sign, but it is hard to say just from the reading of the indicator. Usually, traders are looking for some of the above mentioned characteristics before executing a trade. Therefore, be extremely careful when using this indicator!
B) Stochastic Oversold Levels
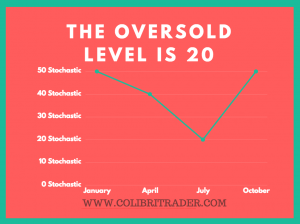
The opposite of overbought is the oversold level. When Stochastic reaches an oversold level, it is thought to have reached its lower bounds. As is the case with the overbought, here too we have an increase of volume. The oversold level is 20. One major question remains- how do we know whether it is time to turn direction and start buying. Stochastic might not be enough, so you should use it either as a part of your trading strategy, or combine different time frames. It might be quite useful to check out some of my previous articles on technical analysis or on defining the trend.
Stochastic Versions
There are usually three versions of Stochastic.
-
Fast- The fast version is the choppiest of all.
-
Slow- The slow version is a smoothed version of the Fast one
-
Full- The full stochastic is a customisable version of the slow stochastic
*Calculations
- Fast
Fast %K = %K basic calculation
Fast %D = 3-period SMA of Fast %K
- Slow
Slow %K = Fast %K smoothed with 3-period SMA
Slow %D = 3-period SMA of Slow %K
- Full
Full %K = Fast %K smoothed with X-period SMA
Full %D = X-period SMA of Full %K
CONCLUSION
As with any other indicator or trading method, using Stochastic is not a holy-grail of trading. If you are using this indicator, you should consider using it in combination with other tools. This article’s aim was to show you technical analysis from another angle. Using many indicators and messing up your charts is definitely not the solution- at least not for me. For the eager ones amongst you, this article should have hopefully revealed another side of trading. You should not forget that when trading, you should be trusting in your abilities more than anything else. Discipline is extremely important and money management and risk management should not be underestimated! You should be very risk averse, since capital is your only asset!
This material is written for educational purposes only. By no means do any of its contents recommend, advocate or urge the buying, selling or holding of any financial instrument whatsoever. Trading and Investing involves high levels of risk. The author expresses personal opinions and will not assume any responsibility whatsoever for the actions of the reader. The author may or may not have positions in Financial Instruments discussed in this newsletter. Future results can be dramatically different from the opinions expressed herein. Past performance does not guarantee future results.
Editors’ Picks

EUR/USD holds firm near 1.1850 amid USD weakness
EUR/USD remains strongly bid around 1.1850 in European trading on Monday. The USD/JPY slide-led broad US Dollar weakness helps the pair build on Friday's recovery ahead of the Eurozone Sentix Investor Confidence data for February.

GBP/USD holds medium-term bullish bias above 1.3600
The GBP/USD pair trades on a softer note around 1.3605 during the early European session on Monday. Growing expectation of the Bank of England’s interest-rate cut weighs on the Pound Sterling against the Greenback.

USD/JPY falls further toward 156.00 as intervention risks dominate
The Japanese Yen is looking to build on its strong intraday move up amid speculations that authorities will step in to stem weakness in the domestic currency. In fact, Japan’s Finance Minister Satsuki Katayama stepped up intervention warnings and confirmed close coordination with the US against disorderly FX moves. This, along with some follow-through US Dollar selling, triggers an intraday USD/JPY turnaround from the 157.65 region, touched in reaction to Prime Minister Sanae Takaichi's landslide win in Sunday's election.
Editors’ Picks
EUR/USD holds firm near 1.1850 amid USD weakness
EUR/USD remains strongly bid around 1.1850 in European trading on Monday. The USD/JPY slide-led broad US Dollar weakness helps the pair build on Friday's recovery ahead of the Eurozone Sentix Investor Confidence data for February.
USD/JPY falls further toward 156.00 as intervention risks dominate
The Japanese Yen is looking to build on its strong intraday move up amid speculations that authorities will step in to stem weakness in the domestic currency. In fact, Japan’s Finance Minister Satsuki Katayama stepped up intervention warnings and confirmed close coordination with the US against disorderly FX moves. This, along with some follow-through US Dollar selling, triggers an intraday USD/JPY turnaround from the 157.65 region, touched in reaction to Prime Minister Sanae Takaichi's landslide win in Sunday's election.

Gold remains supported by China's buying and USD weakness as traders eye US data
Gold struggles to capitalize on its intraday move up and remains below the $5,100 mark heading into the European session amid mixed cues. Data released over the weekend showed that the People's Bank of China extended its buying spree for a 15th month in January. Moreover, dovish US Fed expectations and concerns about the central bank's independence drag the US Dollar lower for the second straight day, providing an additional boost to the non-yielding yellow metal.

Cardano steadies as whale selling caps recovery
Cardano (ADA) steadies at $0.27 at the time of writing on Monday after slipping more than 5% in the previous week. On-chain data indicate a bearish trend, with certain whales offloading ADA. However, the technical outlook suggests bearish momentum is weakening, raising the possibility of a short-term relief rebound if buying interest picks up.

Japan's Takaichi secures historic victory in snap election
In Japan, Prime Minister Sanae Takaichi's coalition secured a supermajority in the lower house, winning 328 out of 465 seats following a rare winter snap election. This provides her with a strong mandate to advance her legislative agenda.
RECOMMENDED LESSONS
Making money in forex is easy if you know how the bankers trade!
I’m often mystified in my educational forex articles why so many traders struggle to make consistent money out of forex trading. The answer has more to do with what they don’t know than what they do know. After working in investment banks for 20 years many of which were as a Chief trader its second knowledge how to extract cash out of the market.
5 Forex News Events You Need To Know
In the fast moving world of currency markets where huge moves can seemingly come from nowhere, it is extremely important for new traders to learn about the various economic indicators and forex news events and releases that shape the markets. Indeed, quickly getting a handle on which data to look out for, what it means, and how to trade it can see new traders quickly become far more profitable and sets up the road to long term success.
Top 10 Chart Patterns Every Trader Should Know
Chart patterns are one of the most effective trading tools for a trader. They are pure price-action, and form on the basis of underlying buying and selling pressure. Chart patterns have a proven track-record, and traders use them to identify continuation or reversal signals, to open positions and identify price targets.
7 Ways to Avoid Forex Scams
The forex industry is recently seeing more and more scams. Here are 7 ways to avoid losing your money in such scams: Forex scams are becoming frequent. Michael Greenberg reports on luxurious expenses, including a submarine bought from the money taken from forex traders. Here’s another report of a forex fraud. So, how can we avoid falling in such forex scams?
What Are the 10 Fatal Mistakes Traders Make
Trading is exciting. Trading is hard. Trading is extremely hard. Some say that it takes more than 10,000 hours to master. Others believe that trading is the way to quick riches. They might be both wrong. What is important to know that no matter how experienced you are, mistakes will be part of the trading process.
The challenge: Timing the market and trader psychology
Successful trading often comes down to timing – entering and exiting trades at the right moments. Yet timing the market is notoriously difficult, largely because human psychology can derail even the best plans. Two powerful emotions in particular – fear and greed – tend to drive trading decisions off course.