![]() Russ Allen
Russ Allen
Online Trading Academy
Today we’ll show how to calculate the potential rates of return on the Covered Call, where an investor writes (i.e. sells) calls on a stock position that they own. The cash received for the options could lower the net cost of the stock position after the fact, enhancing profits (up to a point – but more on that later).
With this strategy, we are selling options and planning to wait for them to expire. When they do expire, our profit or loss will depend on what the stock price is at the time. We can easily calculate what that profit or loss would be given specific projected stock prices.
Let’s demonstrate:
Below is a chart of SPY as of the close on May 20, 2019. Let’s say that we think that SPY will rebound from the nearby demand zone and move up in the near term to around $293. We could consider buying the SPY shares at their current price of $283.96 and simultaneously selling a call option at the $293 strike price, expiring in July. These calls could be sold for $2.30 per share, or $230 for each call option (each option is for 100 shares).
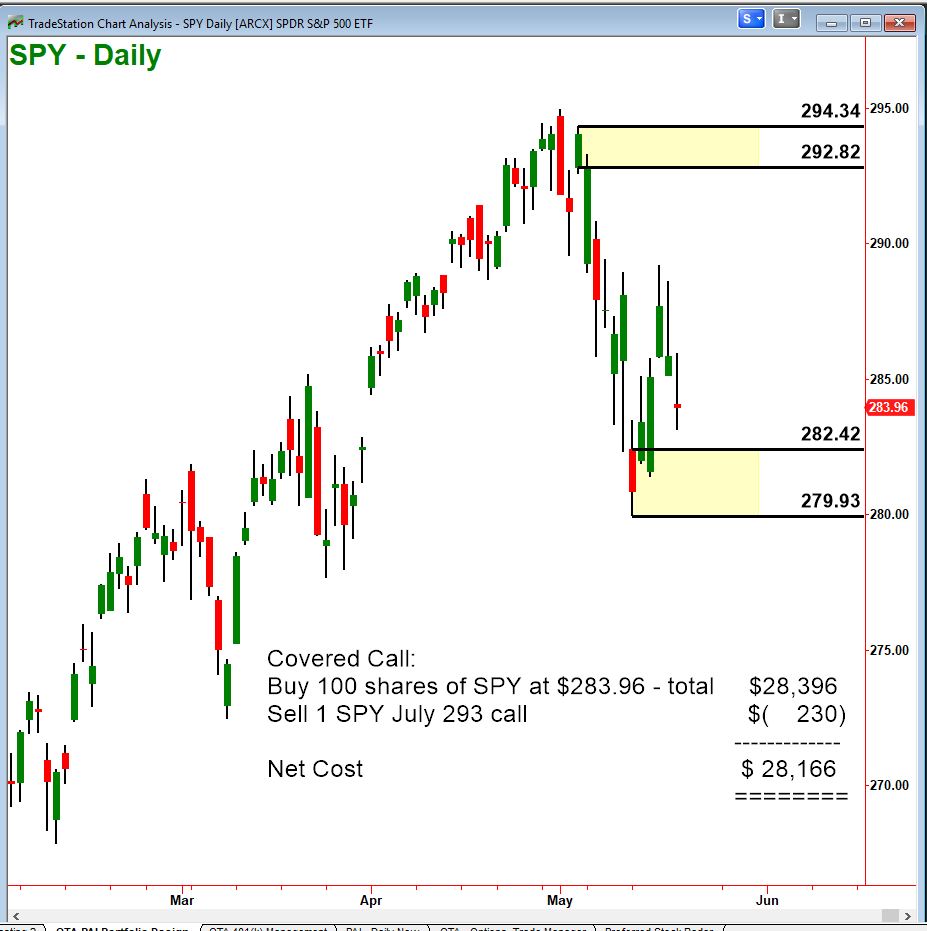
The net cost of the position would be $28,166. This would be like buying the SPY shares at $281.66 each, nicely within the yellow-shaded demand zone.
The rate of return on covered calls depends on how the stock behaves after we put the position on. If the stock goes up, we make a profit on the stock, and that profit is larger because our net cost is reduced. If the stock goes down, then we will lose money, but we will lose less than we would have had we not sold the call. Since, in this case, we sold the calls for $2.30 per share, we now have that amount of cushion. We won’t have an overall loss on the position unless SPY drops by more than $2.30 per share.
Usually the rate of return on covered calls is quoted two ways:
-
Rate of Return if Not Assigned
-
Rate of Return if Assigned
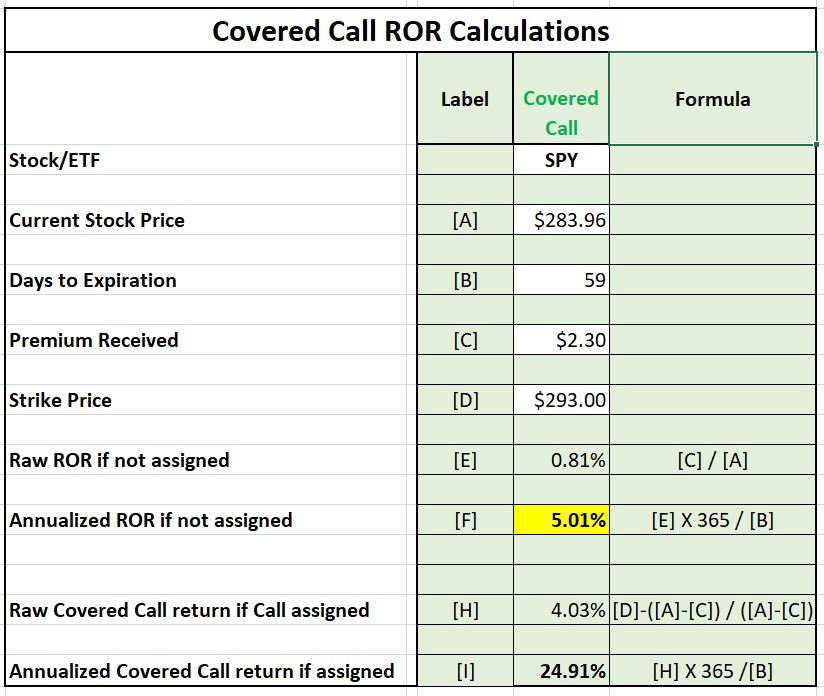
Rate of Return if Not Assigned assumes that the stock price does not move between now and the option expiration date. If we do not make or lose money on the stock during this time, then our net profit will be only what we make on the call itself. If the stock doesn’t go up, then the call will not be assigned and we will get to keep the $230 received for the call. A profit of $230 on an investment of $28,166 would be 81/100 of a percentage point in 59 days or 5.01% annualized. Not a fortune, but is it bad to make a 5% return on something that didn’t go up at all? Sounds OK to me.
The second ROR calculation, Rate of Return if Assigned, is the maximum possible profit on the position. That maximum profit is now limited. Having sold the call option, we are now obligated to turn over the stock to the call buyer when and if ordered to. We certainly will be ordered to if the stock is above $293 at expiration, so our maximum sales price can now be no more than $293. Our maximum profit would thus be our new maximum sales price for the 100 shares of $29,300, less our adjusted cost of $28,166. This is a profit of $1,134. That is 4.03% on our cost of $28,166 in a 59-day period (until the July options expire). That amounts to an annualized return of almost 25% – not bad at all!
These rate of return calculations could be summarized on a simple spreadsheet like the one below.
The calculation of the rates of return on any covered call could be done in the same way. Using a model like this, you could easily compare different covered call opportunities to find those that beat or match your investing goals.
Read the original article here - Rate of Return Calculations on Simple Option Strategies for Investors
This content is intended to provide educational information only. This information should not be construed as individual or customized legal, tax, financial or investment services. As each individual's situation is unique, a qualified professional should be consulted before making legal, tax, financial and investment decisions. The educational information provided in this article does not comprise any course or a part of any course that may be used as an educational credit for any certification purpose and will not prepare any User to be accredited for any licenses in any industry and will not prepare any User to get a job. Reproduced by permission from OTAcademy.com click here for Terms of Use: https://www.otacademy.com/about/terms
Editors’ Picks

EUR/USD clings to small gains near 1.1750
Following a short-lasting correction in the early European session, EUR/USD regains its traction and clings to moderate gains at around 1.1750 on Monday. Nevertheless, the pair's volatility remains low, with investors awaiting this weeks key data releases from the US and the ECB policy announcements.

GBP/USD edges higher toward 1.3400 ahead of US data and BoE
GBP/USD reverses its direction and advances toward 1.3400 following a drop to the 1.3350 area earlier in the day. The US Dollar struggles to gather recovery momentum as markets await Tuesday's Nonfarm Payrolls data, while the Pound Sterling holds steady ahead of the BoE policy announcements later in the week.

Japanese Yen adds to strong gains and drags USD/JPY to 155.00 amid hawkish BoJ bets
The Japanese Yen extends its steady intraday ascent through the Asian session on Monday, dragging the USD/JPY pair to the 155.00 psychological mark in the last hour. Against the backdrop of the recent shift in rhetoric from Bank of Japan Governor Kazuo Ueda, an improvement in business confidence reaffirms market bets for an imminent rate hike this week.
Editors’ Picks
EUR/USD clings to small gains near 1.1750
Following a short-lasting correction in the early European session, EUR/USD regains its traction and clings to moderate gains at around 1.1750 on Monday. Nevertheless, the pair's volatility remains low, with investors awaiting this weeks key data releases from the US and the ECB policy announcements.
GBP/USD edges higher toward 1.3400 ahead of US data and BoE
GBP/USD reverses its direction and advances toward 1.3400 following a drop to the 1.3350 area earlier in the day. The US Dollar struggles to gather recovery momentum as markets await Tuesday's Nonfarm Payrolls data, while the Pound Sterling holds steady ahead of the BoE policy announcements later in the week.

Gold stuck around $4,300 as markets turn cautious
Gold loses its bullish momentum and retreats below $4,350 after testing this level earlier on Monday. XAU/USD, however, stays in positive territory as the US Dollar remains on the back foot on growing expectations for a dovish Fed policy outlook next year.

Solana consolidates as spot ETF inflows near $1 billion signal institutional dip-buying
Solana price hovers above $131 at the time of writing on Monday, nearing the upper boundary of a falling wedge pattern, awaiting a decisive breakout. On the institutional side, demand for spot Solana Exchange-Traded Funds remained firm, pushing total assets under management to nearly $1 billion since launch.

Big week ends with big doubts
The S&P 500 continued to push higher yesterday as the US 2-year yield wavered around the 3.50% mark following a Federal Reserve (Fed) rate cut earlier this week that was ultimately perceived as not that hawkish after all. The cut is especially boosting the non-tech pockets of the market.
RECOMMENDED LESSONS
Making money in forex is easy if you know how the bankers trade!
I’m often mystified in my educational forex articles why so many traders struggle to make consistent money out of forex trading. The answer has more to do with what they don’t know than what they do know. After working in investment banks for 20 years many of which were as a Chief trader its second knowledge how to extract cash out of the market.
5 Forex News Events You Need To Know
In the fast moving world of currency markets where huge moves can seemingly come from nowhere, it is extremely important for new traders to learn about the various economic indicators and forex news events and releases that shape the markets. Indeed, quickly getting a handle on which data to look out for, what it means, and how to trade it can see new traders quickly become far more profitable and sets up the road to long term success.
Top 10 Chart Patterns Every Trader Should Know
Chart patterns are one of the most effective trading tools for a trader. They are pure price-action, and form on the basis of underlying buying and selling pressure. Chart patterns have a proven track-record, and traders use them to identify continuation or reversal signals, to open positions and identify price targets.
7 Ways to Avoid Forex Scams
The forex industry is recently seeing more and more scams. Here are 7 ways to avoid losing your money in such scams: Forex scams are becoming frequent. Michael Greenberg reports on luxurious expenses, including a submarine bought from the money taken from forex traders. Here’s another report of a forex fraud. So, how can we avoid falling in such forex scams?
What Are the 10 Fatal Mistakes Traders Make
Trading is exciting. Trading is hard. Trading is extremely hard. Some say that it takes more than 10,000 hours to master. Others believe that trading is the way to quick riches. They might be both wrong. What is important to know that no matter how experienced you are, mistakes will be part of the trading process.
The challenge: Timing the market and trader psychology
Successful trading often comes down to timing – entering and exiting trades at the right moments. Yet timing the market is notoriously difficult, largely because human psychology can derail even the best plans. Two powerful emotions in particular – fear and greed – tend to drive trading decisions off course.