![]() Russ Allen
Russ Allen
Online Trading Academy
In my last article, I suggested that you make an inventory of all of your investment assets, to make sure that you understand what you have to work with. I mentioned that many people may be in a more precarious situation than they realized, because they don’t understand or haven’t yet utilized the power of diversification. That would be the case if all of your money is exposed to any one market, which would usually be the stock market.
For example, let’s say that an investor has the following assets:
-
$150,000 in an employer’s 401(k), invested in three different funds
-
$250,000 in an Indexed Universal Life insurance policy
-
$200,000 in a Variable Annuity from a reputable insurance company
-
$100,000 in a stock brokerage account, in a diversified portfolio of dividend-paying stocks
In good market conditions, all of those assets will show good returns. But this combination has a big problem: 100% of these assets are exposed to the stock market. If the market suffers a big drop (and that is always not an if, but a when), all of them will drop in value significantly, and all at the same time. The fact is, there is no such thing as a stock market portfolio that is diversified enough. When the giant sucking sound of the next market crash starts, all stocks will suffer, and the amount of that suffering will differ only in degree.
To make sure that you are not in the position of being fully exposed to a stock market drop of 20% (like 2011) or even 50% (like 2008-9), it is important that you make sure that a significant part of your assets are in completely different markets. There are other classes of assets, that are easy and convenient to own, that do not follow the waves in the stock market. Such things include:
-
Cash (earning interest with no market-based risk)
-
Bonds (earning interest with little risk, depending on selection)
-
Carefully selected insurance products like fixed annuities
-
Precious metals (volatile, but not synchronized with the stock market)
-
Commodities (also volatile, but will retain purchasing power in case of high inflation)
-
Real Estate
-
And others
Every portfolio should include significant percentages allocated to at least three completely separate asset classes. In that way, we should always have some assets that are doing well when others are not doing so well. This will make us better able to weather any economic environment.
For example, look at the chart below comparing the above assets during a particularly difficult period, from early 2008 to early 2011:
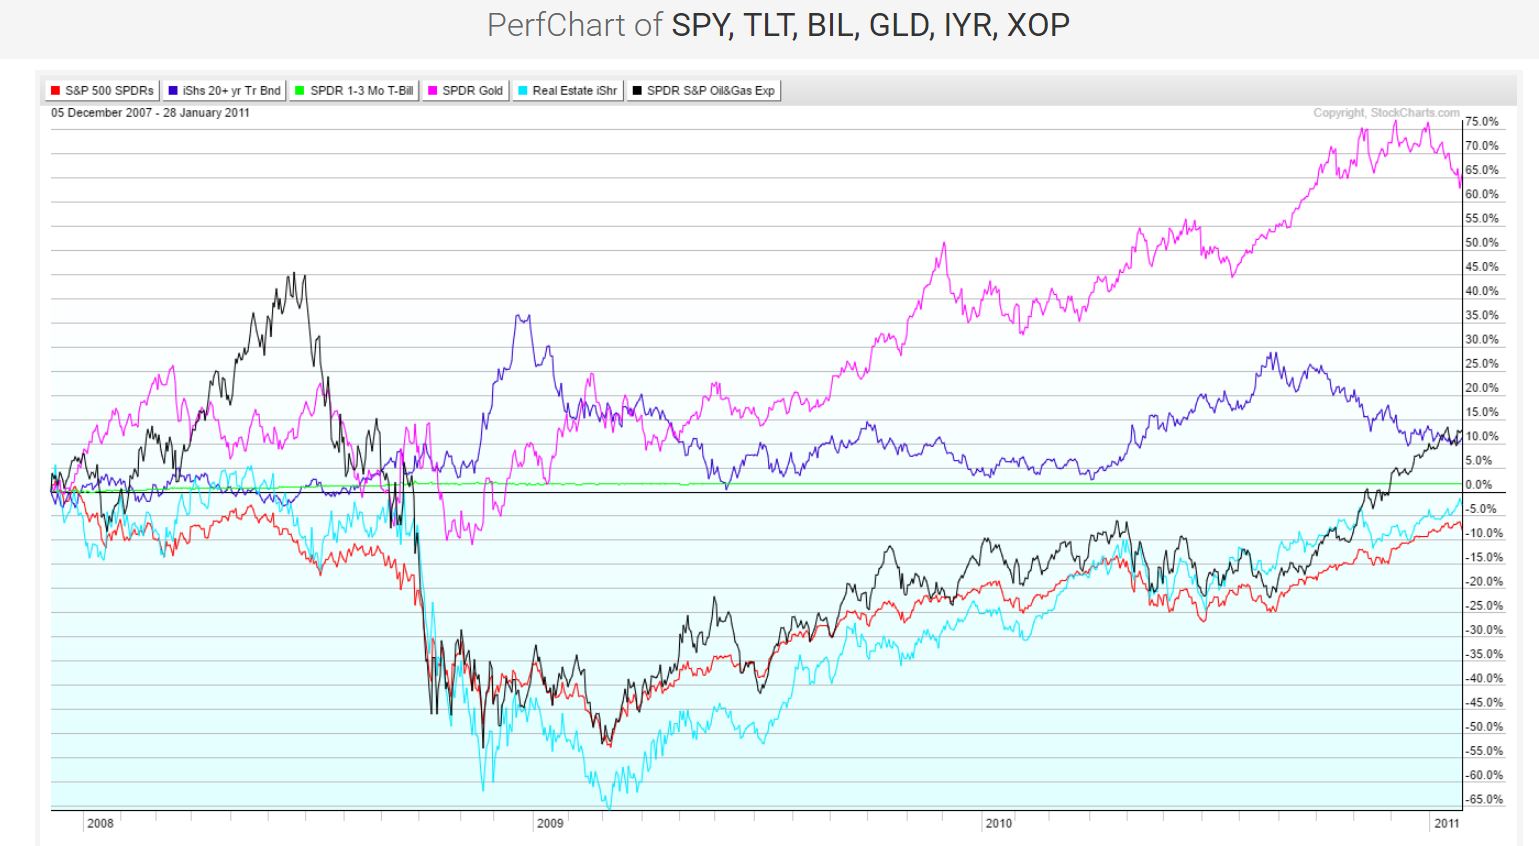
Note the period from the beginning of the chart to the beginning of 2009. That time included the stock market crash of 2008, when the stock market dropped by more than 50% from top to bottom. This is shown by the red line which represents the stock market. During that period the value of commodities (as represented by oil, the black line) and real estate (light blue line) also plunged.
But, cash (green line), of course held steady. Meanwhile U.S. government bonds (purple line) soared in value, and gold (magenta line) was very strong.
So even in the Great Recession, there were assets that did well. And there will almost always be assets that do well. That is why it is vital that you make sure that your investments include multiple asset classes, and particularly some significant amounts in assets that are uncorrelated with the stock market.
A basic tenet of successful investing is this – avoid concentrating your assets in any one market, and instead harness the power of diversification. That is one of the bedrock principles of our Proactive Investing program, and it should be one of yours.
This content is intended to provide educational information only. This information should not be construed as individual or customized legal, tax, financial or investment services. As each individual's situation is unique, a qualified professional should be consulted before making legal, tax, financial and investment decisions. The educational information provided in this article does not comprise any course or a part of any course that may be used as an educational credit for any certification purpose and will not prepare any User to be accredited for any licenses in any industry and will not prepare any User to get a job. Reproduced by permission from OTAcademy.com click here for Terms of Use: https://www.otacademy.com/about/terms
Editors’ Picks

EUR/USD climbs to daily highs near 1.1820
EUR/USD now picks up pace and advances to the area of daily peaks north of the 1.1800 barrier at the end of the week. The pair’s decent move higher comes against the backdrop of a generalised lack of direction in the FX galaxy and the mild offered stance in the US Dollar.

GBP/USD trims losses, retests 1.3460
After briefly challenging its key 200-day SMA near 1.3440, GBP/USD now manages to regain some balance and revisit the 1.3460 zone on Friday. Cable’s pullback comes as the selling pressure on the Greenback gathers traction, reigniting some recovery in the risk-linked space.

Japanese Yen gives back half of early gains against USD ahead of US PPI data
The Japanese Yen (JPY) surrenders half of its early gains against the US Dollar (USD) during the European trading session on Friday. The USD/JPY pair rebounds to near 155.90 as the JPY falls back, but is still 0.15% down.
Editors’ Picks

EUR/USD: Fed calm, ECB steady, but the Dollar still leads Premium
EUR/USD is still struggling to find real traction. The pair has tried to stabilise, but momentum keeps fading, leaving the door open to further weakness.

Gold: Falling US yields, geopolitics help XAU/USD hold ground Premium
Gold (XAU/USD) gained traction and climbed above $5,200, ending the fourth consecutive week in positive territory. The next round of US-Iran talks and crucial macroeconomic data releases from the US will be watched closely by market participants in the short term.
GBP/USD: Will Pound Sterling defend key 1.3450 support ahead of US jobs data? Premium
The Pound Sterling (GBP) entered a bearish consolidation phase against the US Dollar (USD), after having tested critical support near the 1.3450 level on several occasions.

Bitcoin: Another month of losses, and it’s been five
Bitcoin (BTC) price is stabilizing around $68,000 at the time of writing on Friday, but the Crypto King is poised to close February on a fragile footing, marking its fifth consecutive month of losses since October and a rare start to the year with back-to-back monthly corrections.

US Dollar: At a crossroads; Fed steady, tariffs in flux Premium
The US Dollar’s (USD) upward momentum from the previous week seems to have encountered a tough nut to crack in the 98.00 region, as measured by the US Dollar Index (DXY).
RECOMMENDED LESSONS
Making money in forex is easy if you know how the bankers trade!
I’m often mystified in my educational forex articles why so many traders struggle to make consistent money out of forex trading. The answer has more to do with what they don’t know than what they do know. After working in investment banks for 20 years many of which were as a Chief trader its second knowledge how to extract cash out of the market.
5 Forex News Events You Need To Know
In the fast moving world of currency markets where huge moves can seemingly come from nowhere, it is extremely important for new traders to learn about the various economic indicators and forex news events and releases that shape the markets. Indeed, quickly getting a handle on which data to look out for, what it means, and how to trade it can see new traders quickly become far more profitable and sets up the road to long term success.
Top 10 Chart Patterns Every Trader Should Know
Chart patterns are one of the most effective trading tools for a trader. They are pure price-action, and form on the basis of underlying buying and selling pressure. Chart patterns have a proven track-record, and traders use them to identify continuation or reversal signals, to open positions and identify price targets.
7 Ways to Avoid Forex Scams
The forex industry is recently seeing more and more scams. Here are 7 ways to avoid losing your money in such scams: Forex scams are becoming frequent. Michael Greenberg reports on luxurious expenses, including a submarine bought from the money taken from forex traders. Here’s another report of a forex fraud. So, how can we avoid falling in such forex scams?
What Are the 10 Fatal Mistakes Traders Make
Trading is exciting. Trading is hard. Trading is extremely hard. Some say that it takes more than 10,000 hours to master. Others believe that trading is the way to quick riches. They might be both wrong. What is important to know that no matter how experienced you are, mistakes will be part of the trading process.
The challenge: Timing the market and trader psychology
Successful trading often comes down to timing – entering and exiting trades at the right moments. Yet timing the market is notoriously difficult, largely because human psychology can derail even the best plans. Two powerful emotions in particular – fear and greed – tend to drive trading decisions off course.