Option Prices and Stock Prices

In an earlier article, I wrote about the change in an option’s value due to time decay. I mentioned then that there are two additional influences on the price of an option. Today we’ll talk about one of them – the change in price of the underlying stock.
Let’s look at call options. A call option gives its owner the right to buy 100 shares of a specific stock (the underlying stock, or just underlying for short), at a specific price (the strike price), on or before the close of business on a specific future date (the expiration date). Let’s jump right in with a concrete example. On February 19, the stock of IBM closed at $138.19 per share. On that day, there were call options to buy IBM shares at $135 per share, expiring in 120 days on June 21, 2019. The price of the call option was $7.90 per share, or $790 per 100-share option contract.
Anyone who bought that call option was expecting IBM stock to go up in price. Since the option owner had the right to buy IBM at the fixed price of $135, the higher IBM went above $135, the more they could make, with no limit. It would not even be necessary to exercise the option to make a profit if IBM went up; the owner of an option could plan simply to sell the option itself at a higher price.
For example, say that by the expiration date, IBM went up to $150. That is $15 higher than the call strike price of $135. So, the option at that point would have $15 per share of intrinsic value. If it was in fact the expiration date, with no time remaining in the option’s life, then there would be no extrinsic value, also called time value; so, in that case, that $15 of intrinsic value would be the option’s total value. The option owner could sell the option at that time for $15 per share ($1,500 per contract), making a nice profit of $710 on the $790 per contract original investment.
Notice that in this example, the stock price would have gone up from $138.19 to $150, an increase of $11.81 or 8.5%. The option, meanwhile, would have gone from $7.90 to $15.00, an increase of $7.10 or 89%. That’s the power of leverage in option trading – an 8.5% change in the stock led to an 89% gain on the option.
What about that increase in the option price? It was not a one-to-one match with the stock price. Is there a way to estimate how much an option’s price will change when the stock price changes? This would seem to be necessary to calculate potential profit or loss.
In fact, there is. At any moment in time, the ratio of option price change to stock price change can be calculated. It is called the Delta of the option and is readily available. It is normally displayed in the list of options (the option chain). Below is the partial option chain for those IBM June options:
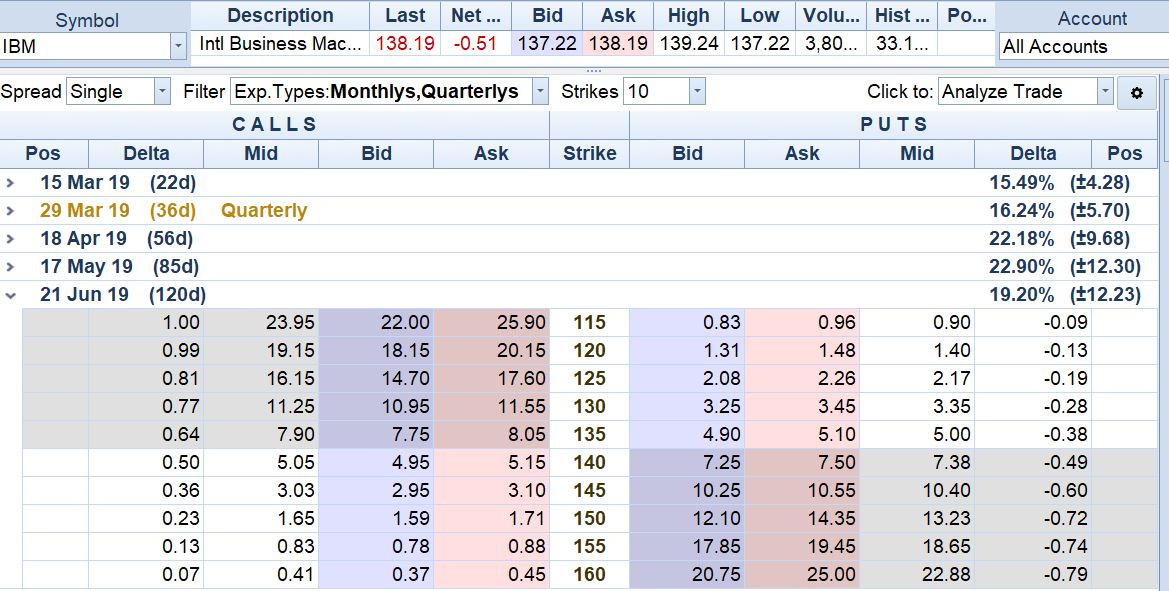
Note the number in the Delta column for the 135 call above. The Delta reading of .64 meant that for the first one dollar that IBM’s stock price went up, the call’s value would go up by .64 cents per share.
Also notice that the options at other strike prices have different Delta values. This shows that Delta is not static. After that next $1.00 move in the stock, the Delta of an option will be different. In fact, as the stock continues to move, for each additional dollar it climbs, the value of the call option will increase by a larger and larger amount. If the stock climbs high enough above the option’s strike price, the option’s delta will reach its maximum value, which is 100%, or 1.0. If the stock continues to go up even farther, then from that point on the option’s price will finally change in a one-to-one ratio with the stock. In that case we say that the option is at parity. In the above chain, the call at the 115 strike is at parity.
Whew! It appears that calculating an option’s price change due to stock movement is not so straightforward, with the Delta constantly changing. But there is help for that. Modern option trading software has a feature called the option profit and loss graph, which can tell us what an option’s price would be given any stock price. The software also knows the current option price, so it can calculate for us what our profit or loss would be given any particular stock price. The profit/loss graph allows us to estimate our profit should the stock hit a target price.
In the graph below, the blue line shows what the profit or loss on this option would be at different stock prices, given the original purchase price of $790 for the contract. The stock price is on the bottom axis; profit/loss is on the left axis. We’ve put in a marker, the gold vertical line, at our target price of $150.
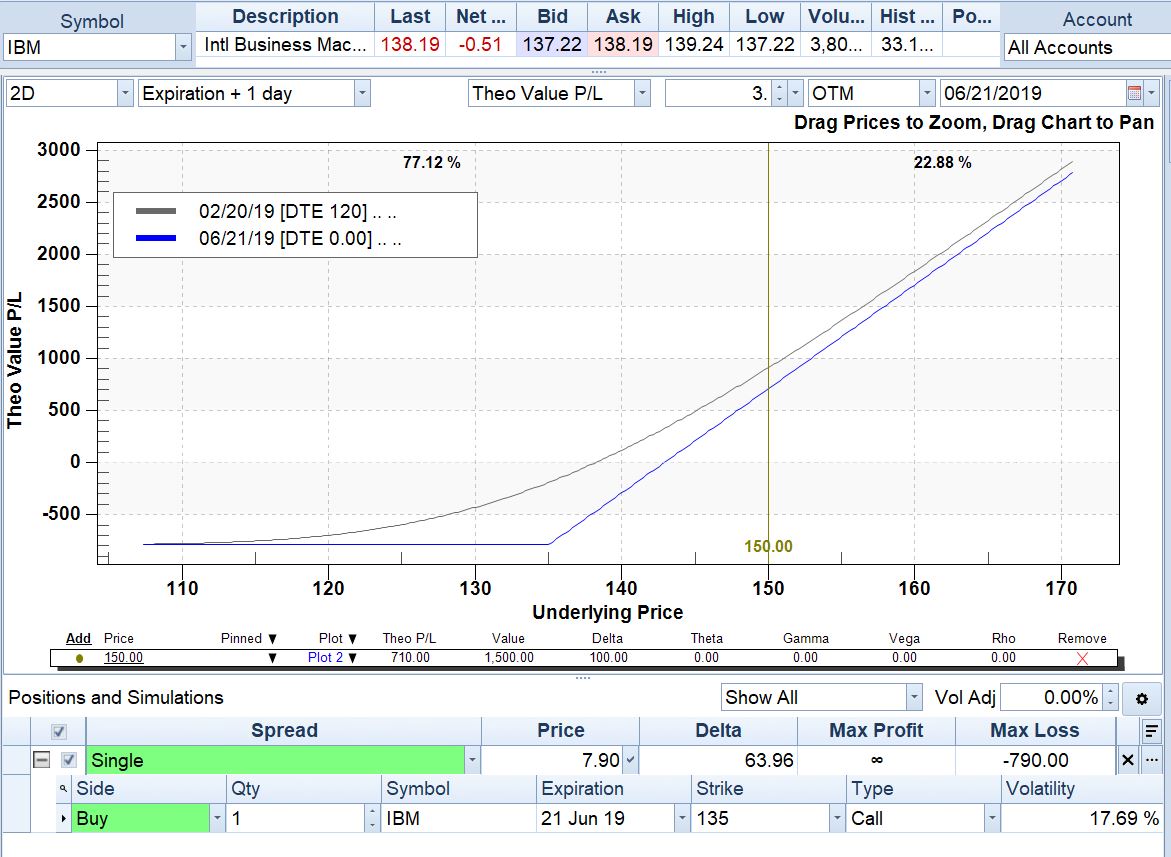
We can see in the boxed table below the graph that at a stock price of $150, the Value of the option would be $1,500, and the theoretical profit or loss (Theo P/L) would be $710.00. We could put in other markers at any stock price we wanted. For example, to calculate how much we would lose if IBM should drop to some predetermined stop-loss price.
To wrap this up, we know that option prices change when the underlying stock price changes. We now know that we can estimate just how much an option’s price will change when the stock reaches any desired target price or stop-loss price. This is the information that we need to calculate reward and risk on our trades. The option P/L graph is our most important tool.
We’ve now looked at the effect on option prices of two of the three forces that move options – time decay and underlying stock price change. Next time, we’ll see how the option graph can tell us the effect of the final one of the three forces.
Until next time, good trading!
Read the original article here - Option Prices and Stock Prices
Author

Russ Allen
Online Trading Academy
Russ decided to make his lifelong passion, trading, his full-time occupation in 2003. With extensive experience in trading, education, and business in general, he sought the highest-quality trading education he could find.


