The Relative Strength Index (RSI) is one of the most popular momentum oscillators in technical analysis. While many traders treat it as a simple overbought/oversold signal, deeper research and long-term observation show that RSI’s behavior shifts depending on the underlying market trend.
This article explains how RSI “range rules” work, why overbought readings can actually signal strength, and how traders and investors can apply these insights effectively across asset classes.
Understanding RSI: Beyond the 0 to 100 Scale
The RSI is typically plotted on a scale from 0 to 100, with overbought levels defined above 70 and oversold levels below 30. Many beginners — myself included in the early years of my career — interpret these thresholds as automatic trade signals: buy when oversold, sell when overbought.
However, this approach often fails in trending markets. With time and experience, I realized that simply reacting to these levels leads to false signals and premature exits from strong trends.
RSI range rules: A more nuanced approach
Constance Brown, in her influential book Technical Analysis for the Trading Professional, introduced the concept of RSI range rules, which state:
-
In an uptrend, RSI operates in a bullish range with lows near 40–50 and highs between 80–90.
-
In a downtrend, RSI stays in a bearish range with lows around 20–30 and highs limited to 55–65.
Rather than focusing solely on extreme levels, traders should observe how high or how low the RSI goes relative to these trend-defined ranges. In my own experience, recognizing these ranges was a breakthrough that helped me shift from chasing reversals to riding trends more confidently.
Example 1: Meta Platforms (META)
On the weekly chart of Meta Platforms (META), the RSI behavior shifted depending on the trend:
-
Downtrend phase: RSI fluctuated between ~20–30 on pullbacks and ~55–65 on rallies.
-
Uptrend phase: RSI lows stabilized above ~40–50, while highs extended into the 80–90 zone.
A key insight is that trend reversals often begin when the RSI no longer reaches prior extremes — a subtle but powerful signal of changing market dynamics. I’ve come to rely on this as one of my earliest clues that a market phase may be transitioning.
Meta weekly chart: Typical RSI ranges in downtrends (20–65) vs. uptrends (40–90).
Example 2: Tencent holdings (700 HK)
Tencent’s monthly chart highlights RSI’s long-term value. While a traditional moving average crossover system would have triggered multiple whipsaws, RSI stayed in a bullish range for nearly 18 years, keeping traders and investors aligned with the prevailing uptrend.
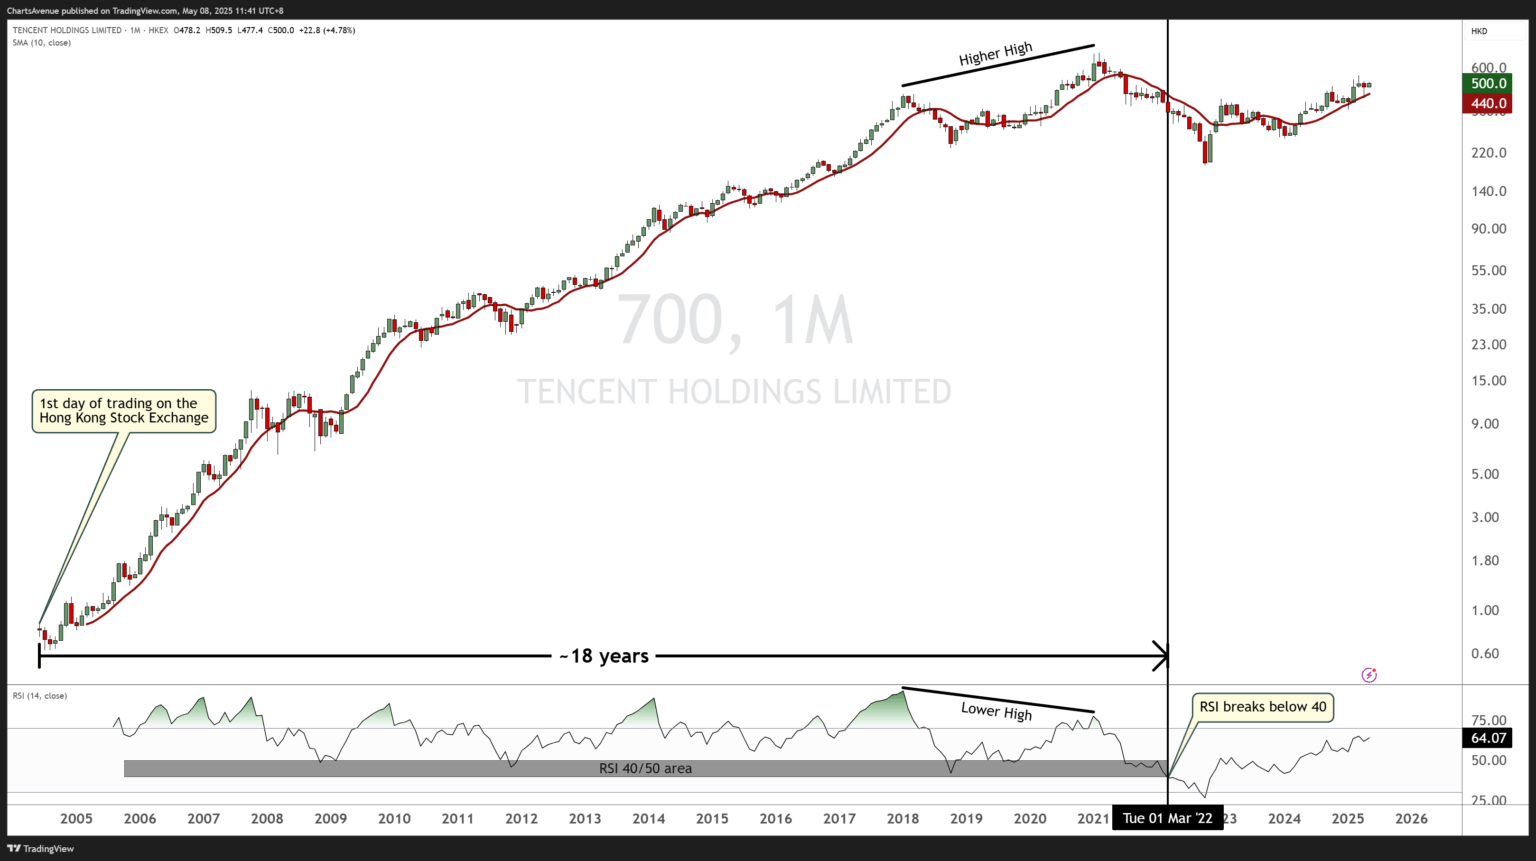
Tencent (700 HK) monthly chart: showing RSI maintaining a bullish range for ~18 years.
Importantly, overbought RSI levels during strong trends signal momentum, not necessarily exhaustion. Early in my work, I underestimated overbought conditions, expecting reversals that often never came. Recognizing them instead as signs of strength was a major mindset shift.
Practical takeaways
-
RSI is most effective when understood in context, not as a standalone signal.
-
Observe whether RSI operates in bullish or bearish ranges relative to the trend.
-
Watch range shifts to identify emerging reversals.
-
Recognize that overbought readings during an uptrend often reflect strength.
Final thoughts
The RSI remains a cornerstone of technical analysis, but its true power emerges when applied with nuance. By understanding RSI range rules, recognizing divergence, and contextualizing overbought/oversold signals, traders and investors can sharpen their edge across market environments.
Personally, I continue to rely on these principles every day as part of my technical process — proof that some lessons, once learned, remain valuable for a lifetime.
Unlock exclusive gold and silver trading signals and updates that most investors don’t see. Join our free newsletter now!
The views and opinions expressed in the posts of the CMT Association are those of the authors and do not necessarily reflect the official policy or position of the CMT Association. The information provided is for general informational purposes only and is not intended as investment advice. The CMT Association does not offer investment management or investment advisory services of any kind. The association strives to maintain the highest standards of professional competence and ethics among its members, who are required to abide by the Code of Ethics and Standards of Professional Conduct.
Editors’ Picks
EUR/USD trades with negative bias around 1.1730 amid recovering USD; downside seems limited
The EUR/USD pair kicks off the new week on a softer note, though it remains within striking distance of the highest level since early October, touched last Thursday. Spot prices currently trade around the 1.1730 region, down less than 0.10% for the day.
GBP/USD holds steady above mid-1.3300s as traders await key data and BoE this week
The GBP/USD pair remains on the defensive during the Asian session on Monday, though it lacks bearish conviction and holds above the 200-day Simple Moving Average pivotal support. Spot prices currently trade around the 1.3360 region, nearly unchanged for the day.
Gold retains bullish bias ahead of this week’s key US macro releases
Gold attracts buyers for the fifth straight day and climbs to the $4,330 region during the Asian session on Monday. The commodity remains well within striking distance of its highest level since October 21, touched on Friday, and seems poised to appreciate further amid a supportive fundamental backdrop.
Solana consolidates as spot ETF inflows near $1 billion signal institutional dip-buying
Solana price hovers above $131 at the time of writing on Monday, nearing the upper boundary of a falling wedge pattern, awaiting a decisive breakout. On the institutional side, demand for spot Solana Exchange-Traded Funds remained firm, pushing total assets under management to nearly $1 billion since launch.
Big week ends with big doubts
The S&P 500 continued to push higher yesterday as the US 2-year yield wavered around the 3.50% mark following a Federal Reserve (Fed) rate cut earlier this week that was ultimately perceived as not that hawkish after all. The cut is especially boosting the non-tech pockets of the market.
RECOMMENDED LESSONS
Making money in forex is easy if you know how the bankers trade!
I’m often mystified in my educational forex articles why so many traders struggle to make consistent money out of forex trading. The answer has more to do with what they don’t know than what they do know. After working in investment banks for 20 years many of which were as a Chief trader its second knowledge how to extract cash out of the market.
5 Forex News Events You Need To Know
In the fast moving world of currency markets where huge moves can seemingly come from nowhere, it is extremely important for new traders to learn about the various economic indicators and forex news events and releases that shape the markets. Indeed, quickly getting a handle on which data to look out for, what it means, and how to trade it can see new traders quickly become far more profitable and sets up the road to long term success.
Top 10 Chart Patterns Every Trader Should Know
Chart patterns are one of the most effective trading tools for a trader. They are pure price-action, and form on the basis of underlying buying and selling pressure. Chart patterns have a proven track-record, and traders use them to identify continuation or reversal signals, to open positions and identify price targets.
7 Ways to Avoid Forex Scams
The forex industry is recently seeing more and more scams. Here are 7 ways to avoid losing your money in such scams: Forex scams are becoming frequent. Michael Greenberg reports on luxurious expenses, including a submarine bought from the money taken from forex traders. Here’s another report of a forex fraud. So, how can we avoid falling in such forex scams?
What Are the 10 Fatal Mistakes Traders Make
Trading is exciting. Trading is hard. Trading is extremely hard. Some say that it takes more than 10,000 hours to master. Others believe that trading is the way to quick riches. They might be both wrong. What is important to know that no matter how experienced you are, mistakes will be part of the trading process.
The challenge: Timing the market and trader psychology
Successful trading often comes down to timing – entering and exiting trades at the right moments. Yet timing the market is notoriously difficult, largely because human psychology can derail even the best plans. Two powerful emotions in particular – fear and greed – tend to drive trading decisions off course.

