Many traders are surprised to hear that financial Futures have a Seasonal pattern. They assume agricultural or energy products do, but not so much the financial products. All markets, regardless of financial or physical, have some form of recurring cyclical pattern (Seasonal pattern) to them.
Currency markets usually exhibit a Seasonal pattern at their countries fiscal year end. Some countries will repatriate their currency or perhaps make expenditures to balance their financial statements for year end.
Interest rate markets will typically have higher yields (lower prices) coming into the April 15th tax season deadline when the government needs to raise cash to pay for tax refunds.
Stock indexes like to see sideways price action between June and September during the slow summer months when many investors are on vacation. Once back from the break the autumn season volatility starts and then we see a rally into year end. The yearend rally is usually called the Santa Claus rally.
These are just some of the typical reasons a financial product could have a reoccurring Seasonal pattern.
In this article I would like to talk about a Seasonal pattern for the futures market that Moore Research has found to be a very reliable Interest rate market strategy. I would like to thank MRCI for permission to use their content for this article.
Note: This information is not to be construed as a trade recommendation, but exclusively for educational purposes only.
I use Seasonal patterns as a market screener each month trying to identify markets that have a Seasonal catalyst to get the price moving in one direction or the other.
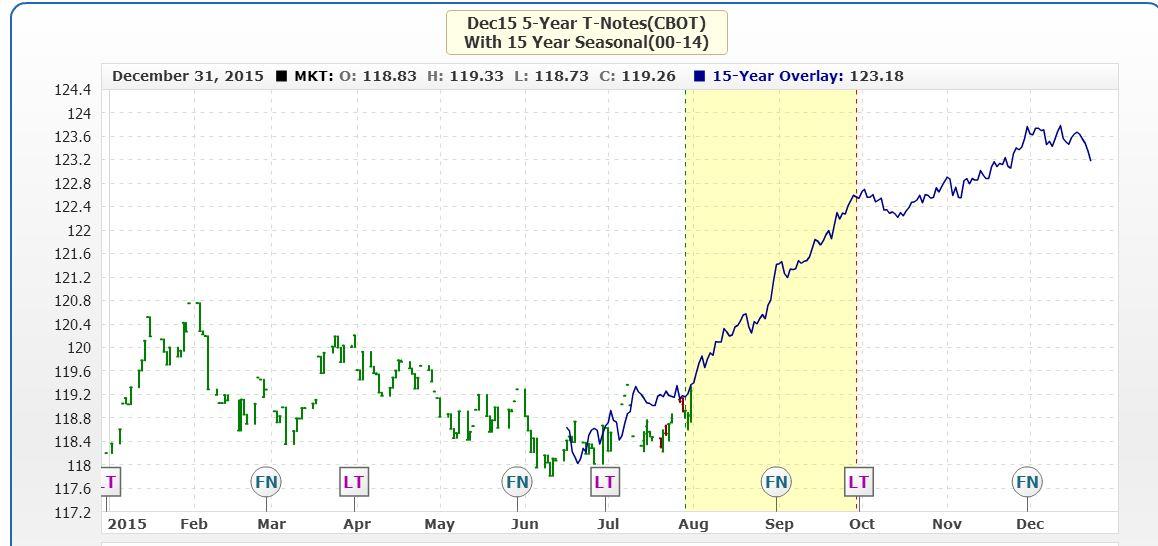
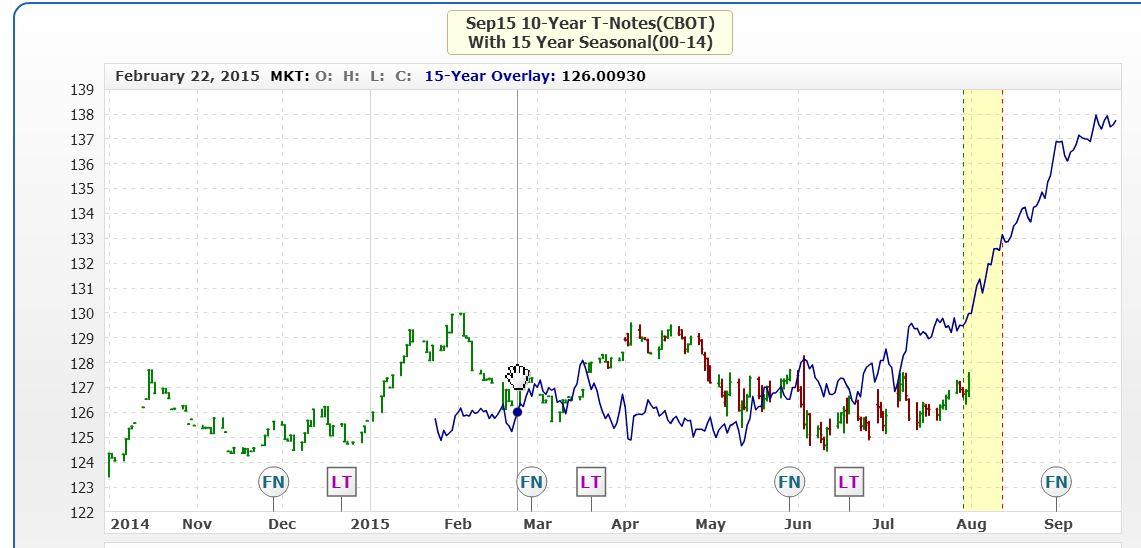
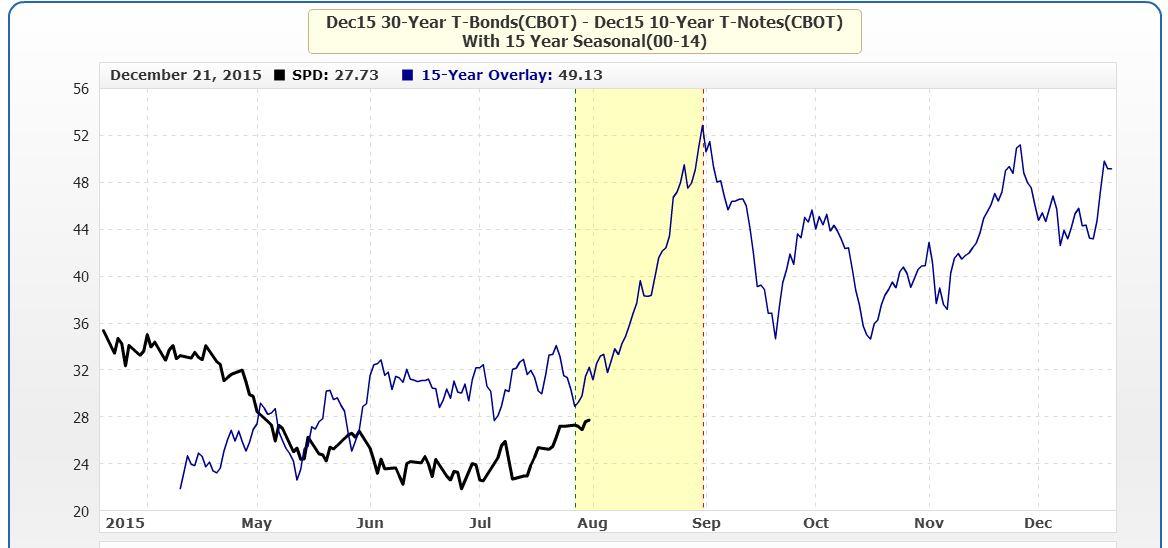
MRCI has found the 5 year Treasury (FV or ZF) has closed higher on Sept 29 than on July 29 100% of the time in the last 15 years. The 10 year Treasury (TY or ZN) has closed higher on Aug 12 than on July 29 93% of the time in the last 15 years. And for Spread traders they have found the Bonds over Notes (BON Spread) has closed higher on Aug 31 than on July 27 93% of the time as well.
MRCI and any trader who uses Seasonal patterns will tell you that a trader should “never ever” blindly buy or sell on a Seasonal date. Even the best Seasonal patterns can fail on any given year. All it takes is an event occurring this year that had not during the testing period of the prior 15 years. This could be weather, geo-political, war or any supply disruption.
A good Seasonal trade still takes analysis to time your entry using a good level. A trend in the direction of the Seasonal is very helpful as well. And of course, a written plan describing how a trader will manage the trade once in it.
Chart 1 shows the 5 year Treasury Seasonal pattern in blue. The yellow vertical box represents the optimal Seasonal window. The blue line represents the 15 year average price action of the 5 year Treasury contract.
Looking at the price action coming into the Seasonal window we can see the market is heading in the right direction to confirm, so far, the Seasonal pattern this year. Even with the talk of the Federal Reserve raising interest rates in September, the price is going higher ignoring the news. Note this trade uses the December Futures contract due to the length of the trade taking you into First Notice day for the September contract. MRCI does a good job keeping a trader out of delivery situations.
Chart 2 is a chart of the 10 year Treasury Seasonal pattern.
Much like Chart 1, price on the 10 year Treasury has started up coming into the Seasonal buy window. Will prices keep going higher? It is up to the individual trader to monitor their positions with protective stops and a price target if needed.
During this time of the year the government does not have to auction as many Treasuries for raising cash going into the United States fiscal year end Sept 30. Perhaps this is the reason for such a high frequency occurrence. This Seasonal pattern should have an impact all across the yield curve with the long end 30 year Treasury responding the most aggressively. The long end of the maturity curve usually acts more violently as there is more fear holding longer dated Treasuries.
The other Seasonal is the Bonds over Notes (BON) Spread. Usually a trader would enter this Spread if they feel that interest rates are going to decline. If a trader thought that rates were going to go up they would trade the Notes over Bonds (NOB) Spread. But with a probability of the BON appreciating it makes sense traders would be looking at the BON instead of NOB.
Chart 3 is a chart of the BON Spread. Unlike Charts 1 & 2 that used candle sticks, the BON chart shows a line on close chart representing where the Spread has closed each day. The dark black line represents the actual Spread this year and the blue line represents the 15 year average price pattern.
A BON Spread would have a trader long December 30 year Bonds and simultaneously short the December 10 year Notes. This is referred to as an Inter-market Spread.
The interesting thing about these 3 trades is how across 2 different styles of trading, Futures and Spreads, both have a very high percentage win rate. When both of these line up it helps support the trade in some cases.
If you feel Seasonal trading might benefit your trading, MRCI still has their complimentary trial subscription. Make sure you are comfortable with technical analysis (OTA’s core strategy) before trying this.
“The year you were born marks only your entry into the world. Other years where you prove your worth, they are the ones worth celebrating.” Jarod Kintz
This content is intended to provide educational information only. This information should not be construed as individual or customized legal, tax, financial or investment services. As each individual's situation is unique, a qualified professional should be consulted before making legal, tax, financial and investment decisions. The educational information provided in this article does not comprise any course or a part of any course that may be used as an educational credit for any certification purpose and will not prepare any User to be accredited for any licenses in any industry and will not prepare any User to get a job. Reproduced by permission from OTAcademy.com click here for Terms of Use: https://www.otacademy.com/about/terms
Editors’ Picks

USD/JPY drops back below 157.00 on Japan's verbal intervention
USD/JPY has come under moderate selling pressure below 157.00 in the Asian session on Monday. The Japanese Yen lost ground to near 157.70 following Japan’s ruling Liberal Democratic Party's outright majority win in Sunday’s lower house election, opening the door to more fiscal stimulus by Prime Minister Sanae Takaichi. However, JPY buyers jumped back and dragged the pair southward on FX verbal intervention by Japan’s Finance Minister Katayama.

Gold eyes acceptance above $5,000, kicking off a big week
Gold is consolidating the latest uptick at around the $5,000 mark, with buyers gathering pace for a sustained uptrend as a critical week kicks off. All eyes remain on the delayed Nonfarm Payrolls and Consumer Price Index data from the United States due on Wednesday and Friday, respectively.

AUD/USD: Buyers eyes 0.7050 amid upbeat mood
AUD/USD builds on Friday's goodish rebound from sub-0.6900 levels and kicks off the new week on a positive note, with bulls awaiting a sustained move and acceptance above mid-0.7000s before placing fresh bets. The widening RBA-Fed divergence, along with the upbeat market mood, acts as a tailwind for the risk-sensitive Aussie amid some follow-through US Dollar selling for the second straight day.

Top Crypto Gainers: Aster, Decred, and Kaspa rise as selling pressure wanes
Altcoins such as Aster, Decred, and Kaspa are leading the broader cryptocurrency market recovery over the last 24 hours, as Bitcoin holds above $70,000 on Monday, up from the $60,000 dip on Thursday.

Weekly column: Saturn-Neptune and the end of the Dollar’s 15-year bull cycle
Tariffs are not only inflationary for a nation but also risk undermining the trust and credibility that go hand in hand with the responsibility of being the leading nation in the free world and controlling the world’s reserve currency.
RECOMMENDED LESSONS
Making money in forex is easy if you know how the bankers trade!
I’m often mystified in my educational forex articles why so many traders struggle to make consistent money out of forex trading. The answer has more to do with what they don’t know than what they do know. After working in investment banks for 20 years many of which were as a Chief trader its second knowledge how to extract cash out of the market.
5 Forex News Events You Need To Know
In the fast moving world of currency markets where huge moves can seemingly come from nowhere, it is extremely important for new traders to learn about the various economic indicators and forex news events and releases that shape the markets. Indeed, quickly getting a handle on which data to look out for, what it means, and how to trade it can see new traders quickly become far more profitable and sets up the road to long term success.
Top 10 Chart Patterns Every Trader Should Know
Chart patterns are one of the most effective trading tools for a trader. They are pure price-action, and form on the basis of underlying buying and selling pressure. Chart patterns have a proven track-record, and traders use them to identify continuation or reversal signals, to open positions and identify price targets.
7 Ways to Avoid Forex Scams
The forex industry is recently seeing more and more scams. Here are 7 ways to avoid losing your money in such scams: Forex scams are becoming frequent. Michael Greenberg reports on luxurious expenses, including a submarine bought from the money taken from forex traders. Here’s another report of a forex fraud. So, how can we avoid falling in such forex scams?
What Are the 10 Fatal Mistakes Traders Make
Trading is exciting. Trading is hard. Trading is extremely hard. Some say that it takes more than 10,000 hours to master. Others believe that trading is the way to quick riches. They might be both wrong. What is important to know that no matter how experienced you are, mistakes will be part of the trading process.
The challenge: Timing the market and trader psychology
Successful trading often comes down to timing – entering and exiting trades at the right moments. Yet timing the market is notoriously difficult, largely because human psychology can derail even the best plans. Two powerful emotions in particular – fear and greed – tend to drive trading decisions off course.


