
Firstly, many thanks for all of your emails and well wishes after the announcement of my move to the USA. Your kind words and messages were appreciated. As a result of this, it got me thinking about the impacts of movement in all areas of life, be it to a new country, a new job or a different home. These are the types of changes which we are all aware of in our lives and that we will always feel a very direct impact from as it is somewhat tangible and something we can directly experience. But what about the movements in our lives which we don’t feel and the impact of those? This led me to thinking more about the world of Forex Markets and how it has such a huge impact on all of our lives as a result of its movement, yet so few of us are even aware of just how important this impact really is.
Whether we like it or not, when we live in a particular country and are earning and saving as much of that nation’s currency as we can, we are effectively long that currency. If you live in Great Britain, then basically you are long GBP. If you live in Japan, you are long the Yen. And, if you live in the USA, you are long the dollar and you have a passive interest in the value of the dollar going up. Think about it like this: if you bought a stock and owned it for the long term, you are long that stock and hoping it will rise in value aren’t you? In fact, in an ideal world we would like everything we own would go up in value, but as we know this isn’t the case. Most things we buy are bought at retail prices and decrease in value over time, like cars, clothes and technology. There are exceptions like real estate; yet, as we know, this can lose value too from time to time. The interesting thing about this though, is that most people completely overlook the actual changes in value of the dollar; the one thing which pays for their home, the cars and everything thing else in between… namely their money. Let me explain this concept further.
Take a look at the S&P 500 Stock Index below on a longer term price chart as featured on the right hand side:
Charting the value of the US dollar
As we can see, the stock market rose significantly during the period of 2003 to 2007, just before the events of the great credit crunch. An investor who bought into the market during this period of time would have enjoyed a significant level of returns upon their capital. If you were educated enough to have bought near the lows in 2003 you would have seen practically a 100% return on your money, and who wouldn’t be happy with that (assuming you closed out and took profit before the sell-off in 2008 of course). However, as great as this is, I would like to draw your attention to the chart on the left as well, as it tells us a very different story.
It is a chart of the US Dollar Index, basically showing the value of the US Dollar overall versus a basket of other global major currencies, such as the Euro, GBP and Yen to name a few. This chart, like any other chart, will show us institutional levels of supply and demand where the major banks and funds are buying and selling US Dollars. By knowing how to read this we can get a fairly good impression of just how valuable the Dollar is at any given time. Looking at the chart from the same period of 2003 to 2007, you will notice how the value of the dollar fell by around 25% at the very same time that the US Stock Market was rallying. What is the impact of this fall to the average investor? Any money that they made by being long on the stock markets was made in Dollars that were gradually being devalued and losing their buying power at the same time. Long story short, you were making money but that money was losing value as you were making it to the tune of 25% less buying power. That’s an impact which is often overlooked by most. And, let’s remember that I am not including the even bigger decline we saw from 2001.
So fast-forward to now. The Dollar has indeed recovered much of its lost buying power but, as we have seen, these are turbulent times in world markets for sure. We have seen a very rocky start to the trading year with volatility on the rise and much confusion and indecision surrounding market sentiment. It has been a lacklustre start with the US Markets sitting much around the price they opened in January. And what of the Dollar? Well, take a look below:
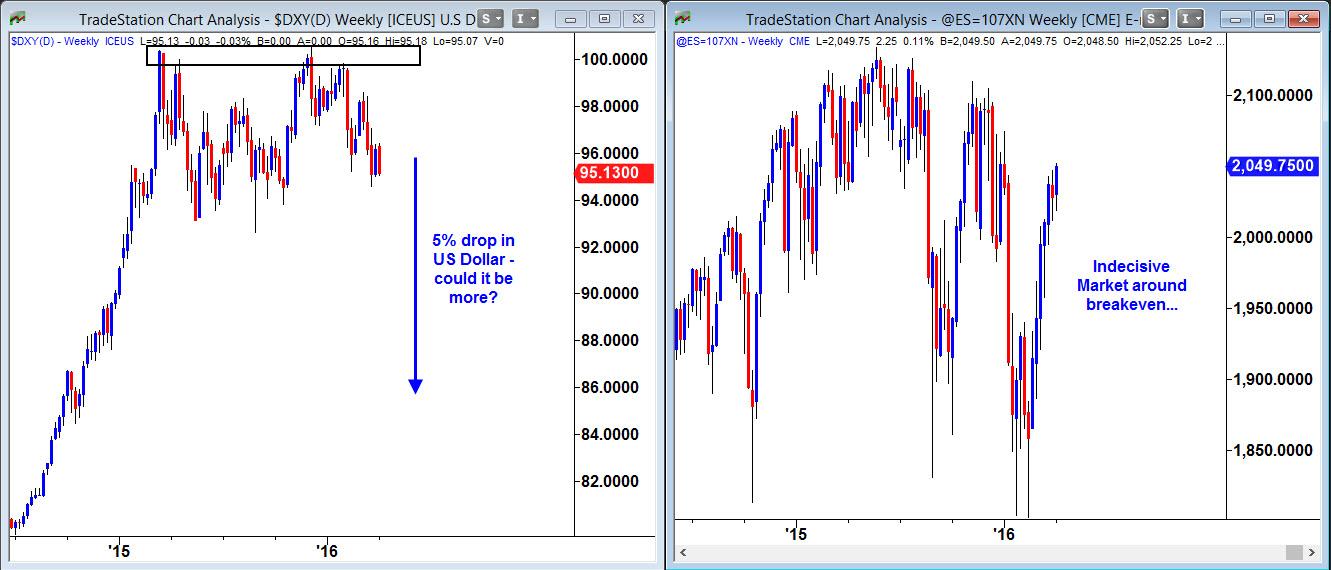
The US Dollar has been testing and rejecting the 100.00 level of supply where institutions have been aggressively selling it for just over a year now. Sure we have not seen any major declines, but as of the time of writing this piece we are down about 5% as of Jan 2016, coupled with a stagnant S&P 500. If the Dollar fails to hold 92.00, then we could see even bigger declines.
Applying a simple hedge of knowing when to buy and sell Dollars at key levels of supply and demand is a powerful cure for this conundrum; and having an awareness of prices in the bigger picture is all it takes to make sure your buying power does not suffer during the good times as well as the bad. I hope you found this helpful.
The information provided is for informational purposes only. It does not constitute any form of advice or recommendation to buy or sell any securities or adopt any investment strategy mentioned. It is intended only to provide observations and views of the author(s) or hosts at the time of writing or presenting, both of which are subject to change at any time without prior notice. The information provided does not have regard to specific investment objectives, financial situation, or specific needs of any specific person who may read it. Investors should determine for themselves whether a particular service or product is suitable for their investment needs or should seek such professional advice for their particular situation. Please see our website for more information: https://bustamanteco.com/privacy-policy/
Editors’ Picks

EUR/USD climbs to daily highs near 1.1820
EUR/USD now picks up pace and advances to the area of daily peaks north of the 1.1800 barrier at the end of the week. The pair’s decent move higher comes against the backdrop of a generalised lack of direction in the FX galaxy and the mild offered stance in the US Dollar.

GBP/USD trims losses, retests 1.3460
After briefly challenging its key 200-day SMA near 1.3440, GBP/USD now manages to regain some balance and revisit the 1.3460 zone on Friday. Cable’s pullback comes as the selling pressure on the Greenback gathers traction, reigniting some recovery in the risk-linked space.

Japanese Yen gives back half of early gains against USD ahead of US PPI data
The Japanese Yen (JPY) surrenders half of its early gains against the US Dollar (USD) during the European trading session on Friday. The USD/JPY pair rebounds to near 155.90 as the JPY falls back, but is still 0.15% down.
Editors’ Picks

EUR/USD: Fed calm, ECB steady, but the Dollar still leads Premium
EUR/USD is still struggling to find real traction. The pair has tried to stabilise, but momentum keeps fading, leaving the door open to further weakness.

Gold: Falling US yields, geopolitics help XAU/USD hold ground Premium
Gold (XAU/USD) gained traction and climbed above $5,200, ending the fourth consecutive week in positive territory. The next round of US-Iran talks and crucial macroeconomic data releases from the US will be watched closely by market participants in the short term.
GBP/USD: Will Pound Sterling defend key 1.3450 support ahead of US jobs data? Premium
The Pound Sterling (GBP) entered a bearish consolidation phase against the US Dollar (USD), after having tested critical support near the 1.3450 level on several occasions.

Bitcoin: Another month of losses, and it’s been five
Bitcoin (BTC) price is stabilizing around $68,000 at the time of writing on Friday, but the Crypto King is poised to close February on a fragile footing, marking its fifth consecutive month of losses since October and a rare start to the year with back-to-back monthly corrections.

US Dollar: At a crossroads; Fed steady, tariffs in flux Premium
The US Dollar’s (USD) upward momentum from the previous week seems to have encountered a tough nut to crack in the 98.00 region, as measured by the US Dollar Index (DXY).
RECOMMENDED LESSONS
Making money in forex is easy if you know how the bankers trade!
I’m often mystified in my educational forex articles why so many traders struggle to make consistent money out of forex trading. The answer has more to do with what they don’t know than what they do know. After working in investment banks for 20 years many of which were as a Chief trader its second knowledge how to extract cash out of the market.
5 Forex News Events You Need To Know
In the fast moving world of currency markets where huge moves can seemingly come from nowhere, it is extremely important for new traders to learn about the various economic indicators and forex news events and releases that shape the markets. Indeed, quickly getting a handle on which data to look out for, what it means, and how to trade it can see new traders quickly become far more profitable and sets up the road to long term success.
Top 10 Chart Patterns Every Trader Should Know
Chart patterns are one of the most effective trading tools for a trader. They are pure price-action, and form on the basis of underlying buying and selling pressure. Chart patterns have a proven track-record, and traders use them to identify continuation or reversal signals, to open positions and identify price targets.
7 Ways to Avoid Forex Scams
The forex industry is recently seeing more and more scams. Here are 7 ways to avoid losing your money in such scams: Forex scams are becoming frequent. Michael Greenberg reports on luxurious expenses, including a submarine bought from the money taken from forex traders. Here’s another report of a forex fraud. So, how can we avoid falling in such forex scams?
What Are the 10 Fatal Mistakes Traders Make
Trading is exciting. Trading is hard. Trading is extremely hard. Some say that it takes more than 10,000 hours to master. Others believe that trading is the way to quick riches. They might be both wrong. What is important to know that no matter how experienced you are, mistakes will be part of the trading process.
The challenge: Timing the market and trader psychology
Successful trading often comes down to timing – entering and exiting trades at the right moments. Yet timing the market is notoriously difficult, largely because human psychology can derail even the best plans. Two powerful emotions in particular – fear and greed – tend to drive trading decisions off course.