![]()
Hello traders! This week’s newsletter will discuss the differences between two different commonly used trend tools, trendlines and moving averages, with an emphasis on trendlines.
As stated in a previous article, moving averages can help traders potentially determine a trend and also possibly get them better prices when they trade. Moving averages can be very helpful, but are also one of the tools that are most commonly misused by novice traders. Another one of my favorite trend following tools is the trendline, let’s take a look!
As usual, I’ll use Investopedia’s definition:
DEFINITION OF ‘TRENDLINE‘
A line that is drawn over pivot highs or under pivot lows to show the prevailing direction of price. Trendlines are a visual representation of support and resistance in any time frame.
Before we jump into some charts, I want to add that we at Online Trading Academy use quality supply zones to sell and quality demand zones to buy-NOT support and resistance. Using trendlines to determine trend and WHICH supply and demand to focus on is what we’ll discuss this week.
Now, there are two basic schools of thought on how to draw in trendlines. The first is to use the ABSOLUTE high and low pivots to draw in your lines. The second, and the one that I personally use, is to look for the lines that have the most touches WITHOUT drawing through candlestick bodies. I don’t mind drawing through candle wicks or tails, but I won’t draw through bodies to determine a valid trendline. These lines are commonly drawn using two pivots (or touches), but it takes at least three touches to validate or confirm the trendline for trading purposes; the more touches the better as far as I’m concerned! If you find a trendline with 5 or more touches, someone with more money than me HAD to be drawing in the same line and trading from it; that many touches can’t be a coincidence, can it?
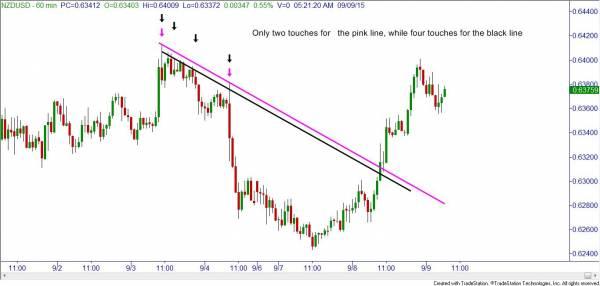
In this NZDUSD chart, the trader using the absolute pivot highs to draw in the downward sloping line only had two touches of the line before price action broke through it. The trader drawing for the most touches while not drawing through candle bodies would have had four touches, giving us a valid line. One of the main reasons I prefer to use the number of touches technique is because with the spot forex market, not everyone sees the exact same pivot highs and low. This is because spot forex is not a centralized market where all trades are reported to one exchange and everyone sees the exact same prices. When looking at these pivot highs and lows, one broker might be a handful of pips off from another broker. The farther forward in time you go, the farther and farther apart their respective trendlines will become. In the futures market, which has a centralized exchange, I use the same technique which so far has worked fine for me.
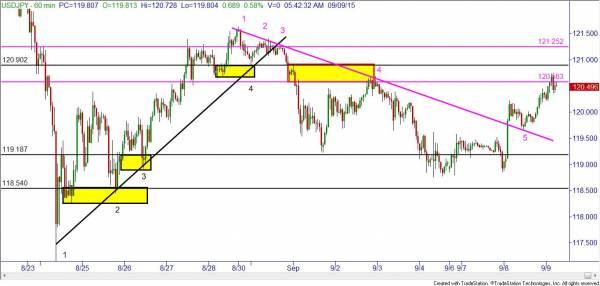
In the following rather convoluted chart, I drew in an upward sloping black trendline with 4 touches and 3 demand zones that could have been used for a long entry. By using the INTERSECTION of a trendline and a demand or supply zone to place trades, very often the trader will be more selective in their trading. As we like to say, we get paid on the quality of our trades, not the quantity. At the touches of the downward sloping pink line, the trader could have entered a short trade at touch marked “4” and also at the touch marked “3.” I didn’t draw in the supply zone at “3” as the chart was getting too messy. You’re welcome. That was one extra tidbit to indicate that the line was drawn correctly. Notice the touch of the pink line at “5?” Whenever I notice a trendline that breaks but then gets touched again coming in from the opposite direction, it “proves” to me that it was a valid trendline. Now, this doesn’t happen every time of course, but it is a nice pat on the back to see that.
Now it’s time for you to do some work. Put your favorite moving averages on the same USDJPY 60 minute chart and scroll back to the same time. Where would your technique have gotten you in? Very often the moving average techniques I see from new traders gets them in much later than this trendline tool.
There are many different ways to use trendlines, these include drawing in channels, triangles, etc. All can be helpful when used in conjunction with our core strategy of buying in demand and selling in supply. These other techniques will be covered in a future newsletter.
This content is intended to provide educational information only. This information should not be construed as individual or customized legal, tax, financial or investment services. As each individual's situation is unique, a qualified professional should be consulted before making legal, tax, financial and investment decisions. The educational information provided in this article does not comprise any course or a part of any course that may be used as an educational credit for any certification purpose and will not prepare any User to be accredited for any licenses in any industry and will not prepare any User to get a job. Reproduced by permission from OTAcademy.com click here for Terms of Use: https://www.otacademy.com/about/terms
Editors’ Picks

USD/JPY gathers strength to near 157.50 as Takaichi’s party wins snap elections
The USD/JPY pair attracts some buyers to around 157.45 during the early Asian session on Monday. The Japanese Yen weakens against the US Dollar after Japan’s ruling Liberal Democratic Party won an outright majority in Sunday’s lower house election, opening the door to more fiscal stimulus by Prime Minister Sanae Takaichi.

EUR/USD: US Dollar to remain pressured until uncertainty fog dissipates
Unimpressive European Central Bank left monetary policy unchanged for the fifth consecutive meeting. The United States first-tier employment and inflation data is scheduled for the second week of February. EUR/USD battles to remain afloat above 1.1800, sellers moving to the sidelines.

Gold: Volatility persists in commodity space
After losing more than 8% to end the previous week, Gold remained under heavy selling pressure on Monday and dropped toward $4,400. Although XAU/USD staged a decisive rebound afterward, it failed to stabilize above $5,000. The US economic calendar will feature Nonfarm Payrolls and Consumer Price Index data for January, which could influence the market pricing of the Federal Reserve’s policy outlook and impact Gold’s performance.

Week ahead: US NFP and CPI data to shake Fed cut bets, Japan election looms
US NFP and CPI data awaited after Warsh’s nomination as Fed chief. Yen traders lock gaze on Sunday’s snap election. UK and Eurozone Q4 GDP data also on the agenda. China CPI and PPI could reveal more weakness in domestic demand.

Three scenarios for Japanese Yen ahead of snap election Premium
The latest polls point to a dominant win for the ruling bloc at the upcoming Japanese snap election. The larger Sanae Takaichi’s mandate, the more investors fear faster implementation of tax cuts and spending plans.
RECOMMENDED LESSONS
Making money in forex is easy if you know how the bankers trade!
I’m often mystified in my educational forex articles why so many traders struggle to make consistent money out of forex trading. The answer has more to do with what they don’t know than what they do know. After working in investment banks for 20 years many of which were as a Chief trader its second knowledge how to extract cash out of the market.
5 Forex News Events You Need To Know
In the fast moving world of currency markets where huge moves can seemingly come from nowhere, it is extremely important for new traders to learn about the various economic indicators and forex news events and releases that shape the markets. Indeed, quickly getting a handle on which data to look out for, what it means, and how to trade it can see new traders quickly become far more profitable and sets up the road to long term success.
Top 10 Chart Patterns Every Trader Should Know
Chart patterns are one of the most effective trading tools for a trader. They are pure price-action, and form on the basis of underlying buying and selling pressure. Chart patterns have a proven track-record, and traders use them to identify continuation or reversal signals, to open positions and identify price targets.
7 Ways to Avoid Forex Scams
The forex industry is recently seeing more and more scams. Here are 7 ways to avoid losing your money in such scams: Forex scams are becoming frequent. Michael Greenberg reports on luxurious expenses, including a submarine bought from the money taken from forex traders. Here’s another report of a forex fraud. So, how can we avoid falling in such forex scams?
What Are the 10 Fatal Mistakes Traders Make
Trading is exciting. Trading is hard. Trading is extremely hard. Some say that it takes more than 10,000 hours to master. Others believe that trading is the way to quick riches. They might be both wrong. What is important to know that no matter how experienced you are, mistakes will be part of the trading process.
The challenge: Timing the market and trader psychology
Successful trading often comes down to timing – entering and exiting trades at the right moments. Yet timing the market is notoriously difficult, largely because human psychology can derail even the best plans. Two powerful emotions in particular – fear and greed – tend to drive trading decisions off course.


