Difference between a futures settle and last trade price

When traders come from trading the Equity market into trading the Futures markets, they will need to understand a subtle nuance in Futures charting. While there are many, I will focus on the difference between a settlement price and a last trade price for this article. Once you understand the difference we will discuss how knowing the difference can save you some money when setting up your trades.
Many Futures contracts now trade during the day and evening session for both electronically and pit traded venues. This gives the trader more trading hours to participate in the markets and helps, but not eliminates the possibility of large gaps against their positions. The Futures Exchanges will have the electronic trading open in some cases 23 hours per day. The trading pits however are only open for 5 -7 hours per day. Even with the shorter trading hours the pit session, also known as Regular Trading Hours (RTH) facilitates approximately 85 – 90% of the overall daily volume. The afterhours trading, commonly referred to as Extended Trading Hours (ETH), does much less volume.
I will use the Ten Year Treasury (TY) contract for my example in this article. Keep in mind that many Futures markets including the Stock Indexes now have a settle price and a last trade price.
To find out if your market has a settlement price and a last trade price visit their respectful contract specifications page at the CMEGroup homepage. Scroll down until you find “Settlement Procedure” then click on “Daily Settlement Procedure.”
The CMEGroup explains how they calculate the settlement price:
The lead month is the anchor leg for settlements and is the contract expected to be the most active.
Tier 1: If the lead month contract trades on Globex between 13:59:30 and 14:00:00 Central Time (CT), then the lead month settles to the volume-weighted average price (VWAP) of the trade(s) during this period.
This settlement price is then sent to all chart vendors and is placed as the official settlement price for the trading day on your Daily and higher timeframe charts, not intraday charts. The settlement price is the one used for mark to the market at the end of the trading day. If you had a profit or loss for the trading day this is the price that would be used to calculate it.
The last trade price is just that, the last price the market traded at when it officially closed. Since the settlement price is often calculated an hour or two before the official close of the day there will often be different prices on your charts for the last price of the day. For example, the TY officially closes at 17:00 Eastern Time. However, the settlement price comes when the RTH session ends (15:00 Eastern Time) as per the Exchange rule above.
In the following charts you will see an example of how the TY traded much higher in the ETH’s session after the RTH session settlement price was much lower.
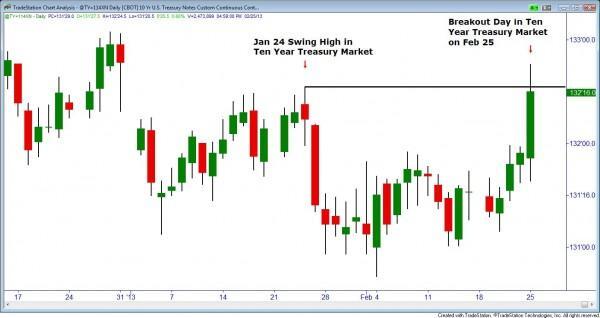
Figure 1 shows an intraday chart of the TY. Anytime you look at an intraday chart in the Futures markets you will be seeing the last trade price of the day and not the official settlement price.
-637973575209361613.jpg)
Looking at the chart we can see that on Feb 25 the last trade price closed above the previous swing high of Jan 24. The last trade price for Feb 25 was 132’225. If you were a trader who likes to see a daily close beyond a previous high to confirm a breakout and you only looked at an intraday chart you might be in for a surprise. The Fig 1 chart shows the last trade price of the day that occurred at 17:00 Eastern Time.
Closing daily prices are strong signals that can confirm market directions. Therefore we need to look at the correct close or we could get a lot of false signals.
Figure 2 will illustrate a daily TY chart.
Wow! Do you see the difference in these two charts? The daily chart will have the settlement price on the candle. The settlement price for Feb 25 was actually 132’160 and was calculated using the Exchange rule above at the Feb 25 RTH session close. This is a 13 tick difference from Fig 1 where we saw the last trade price of the day. Also, notice how on the daily chart that the market did not settle (close) above the Jan 24 swing high. Was this a bull trap? Where intraday prices trade through a previous high, but are unable to close beyond that point.
This is the official price from the Exchange that will be used for accounting procedures for the winners and losers of the day. Of course this accounting procedure only applies if you carry your positions overnight.
Gaps are another consideration when looking at the Futures markets. While I was writing this article the ETH session opened for the TY and the official open was 132’215. If you only looked at your intraday charts you would not see a gap because the last trade price was 132’225. However, the professional trader is looking at their daily timeframe chart and realizes that the market settled at 132’160 and this opening price created a gap up of 11 TY ticks. Being how overextended the market became for this one day of trading it seems likely the TY will try and fill this gap sometime during the ETH session. The professional trader will find this opportunity while the novice will be focused on their intraday charts only.
When trading the markets it is always wise to view the markets from multiple timeframes. But you must be aware of these settlement and last trade prices so when the market speaks to you it will make more sense.
“Worry does not empty tomorrow of its sorrows, it empties today of its strength” Corrie Boom
Author

Don Dawson
Online Trading Academy
Don has been trading the futures markets for 20 years. His perseverance through the ups and downs of trading, openness to experience of others, balanced tolerance for risk and patience to wait for his setups are a few of his strengths as a trader.


