![]() Brandon Wendell, CMT
Brandon Wendell, CMT
Brandon Wendell
Two questions I always receive when people find out that I trade for a living are: Where do you see the markets going? and, Are there any sure fire shortcuts to making money?Are there any sure fire shortcuts to making money? The first question is easy to answer by viewing the charts of the securities you want to trade. The second question doesn’t have an answer because there is no magic formula that exists. To become successful in the markets, you need the right education, a mentor and the willingness to put in the time to build your skills.
Utilizing the chart reading skill set I acquired through my own educational path as a student at Online Trading Academy, I do see the potential for a sharp market downturn beginning now. The following weekly chart of the S&P 500 stock index shows that prices are dropping from the second touch of a supply zone.
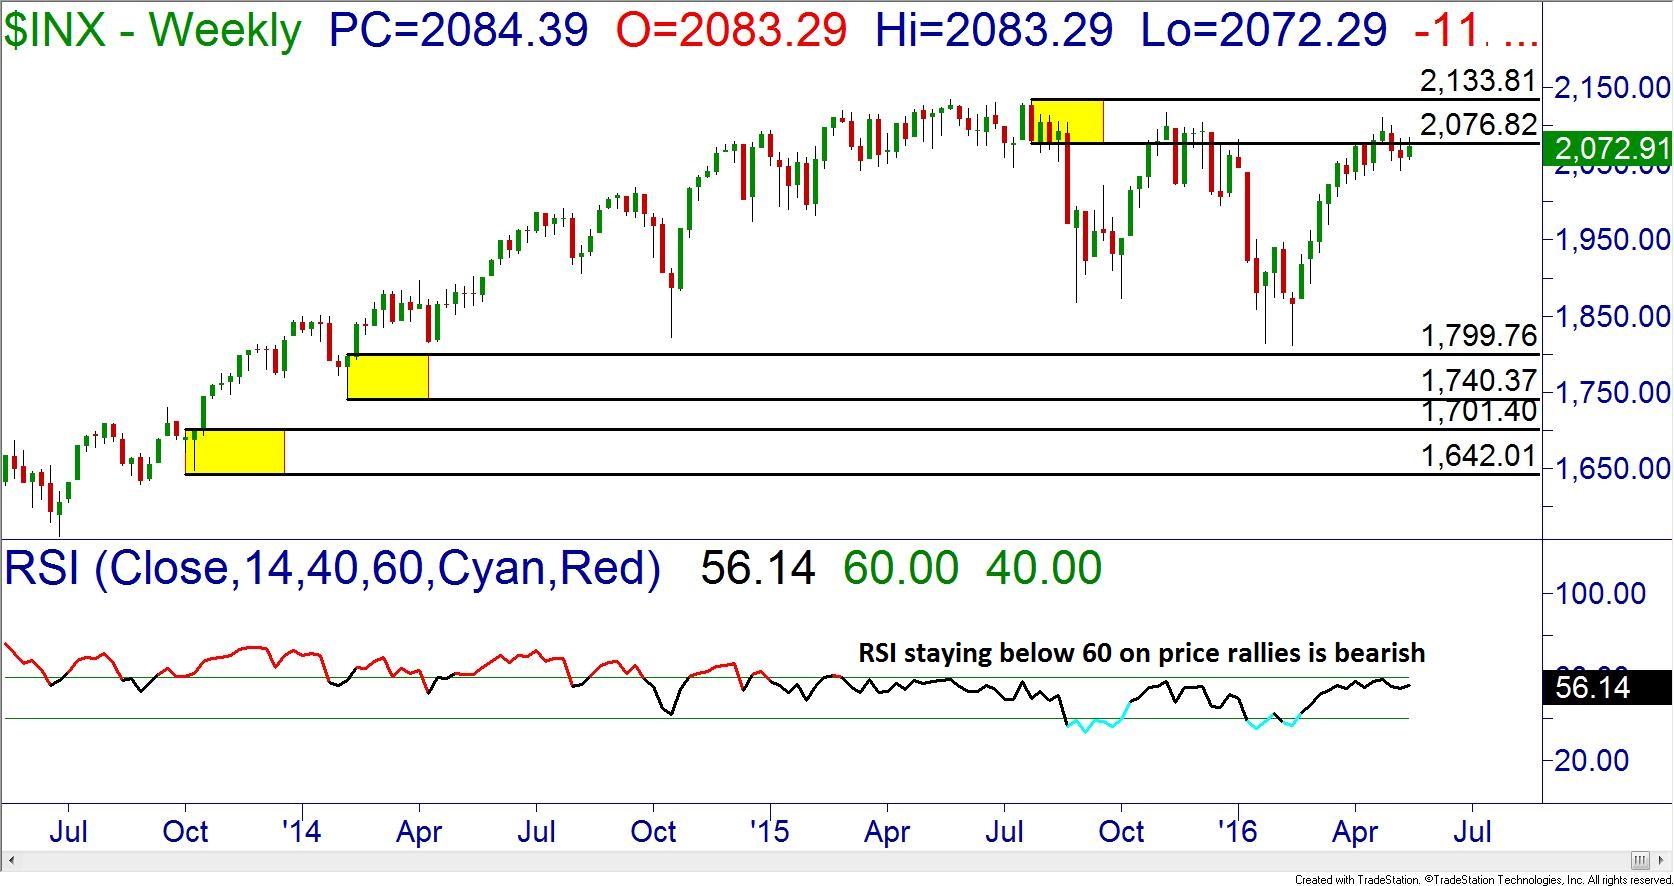
The trend never gained enough strength in April to take out the highs that we formed in late 2015, nor did it cause the RSI indicator to break 60. In previous articles, I have discussed the use of the RSI for trend indication.
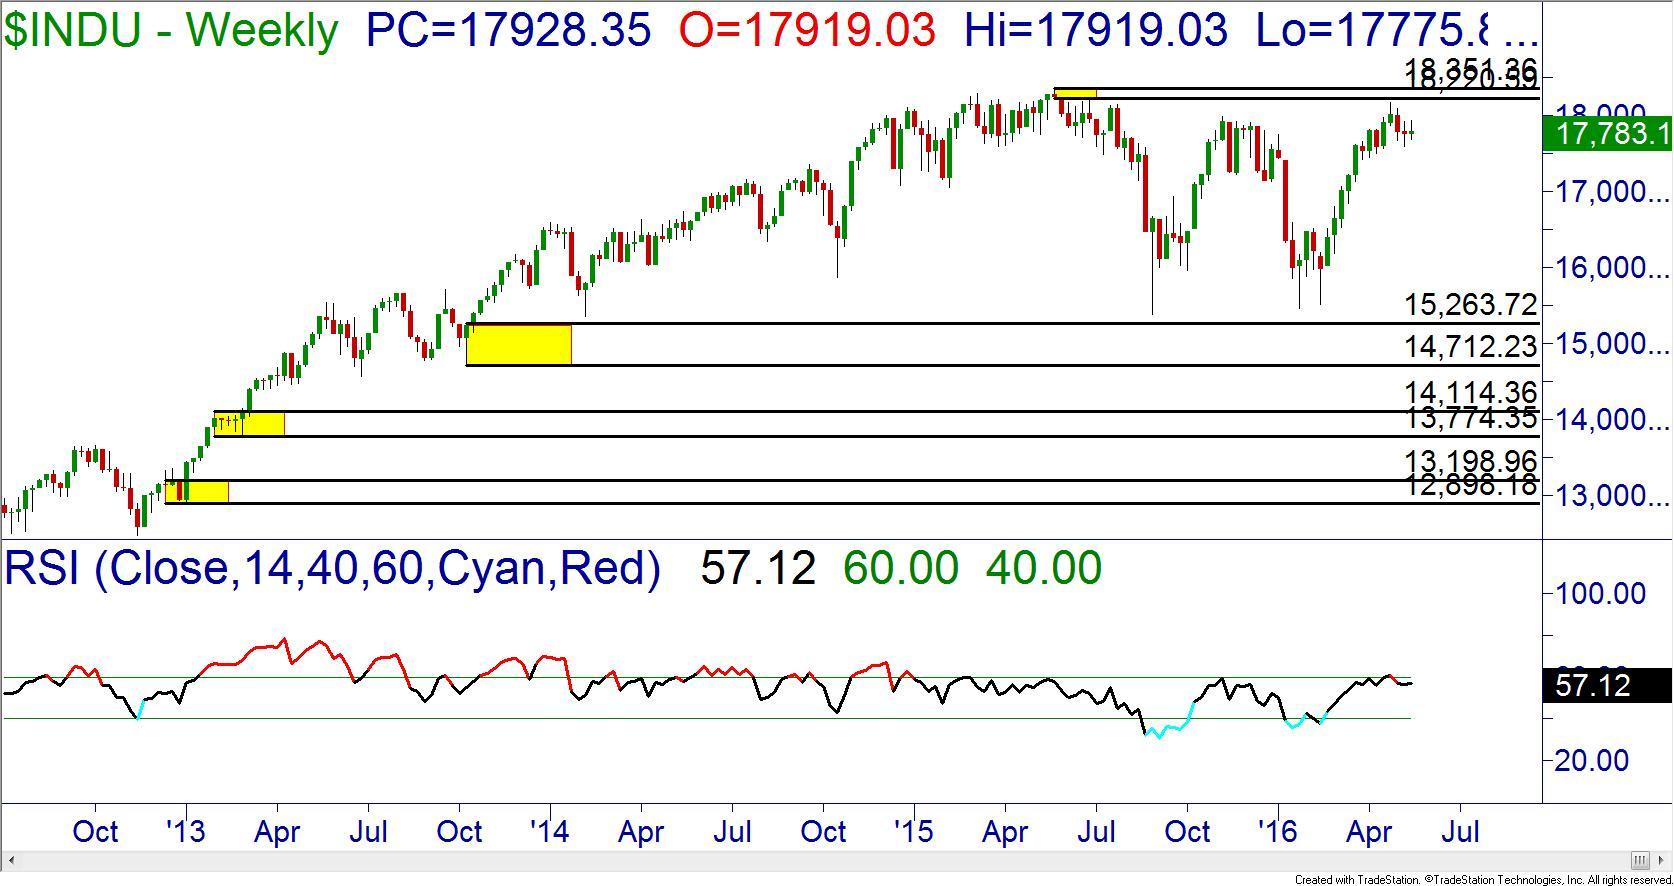
Even though major news outlets were celebrating the Dow Index making new 2016 highs, they neglected to mention the supply zone near 18220 from early 2015. Prices were so weak that they actually failed to even reach the zone before being dragged down by the other indexes.
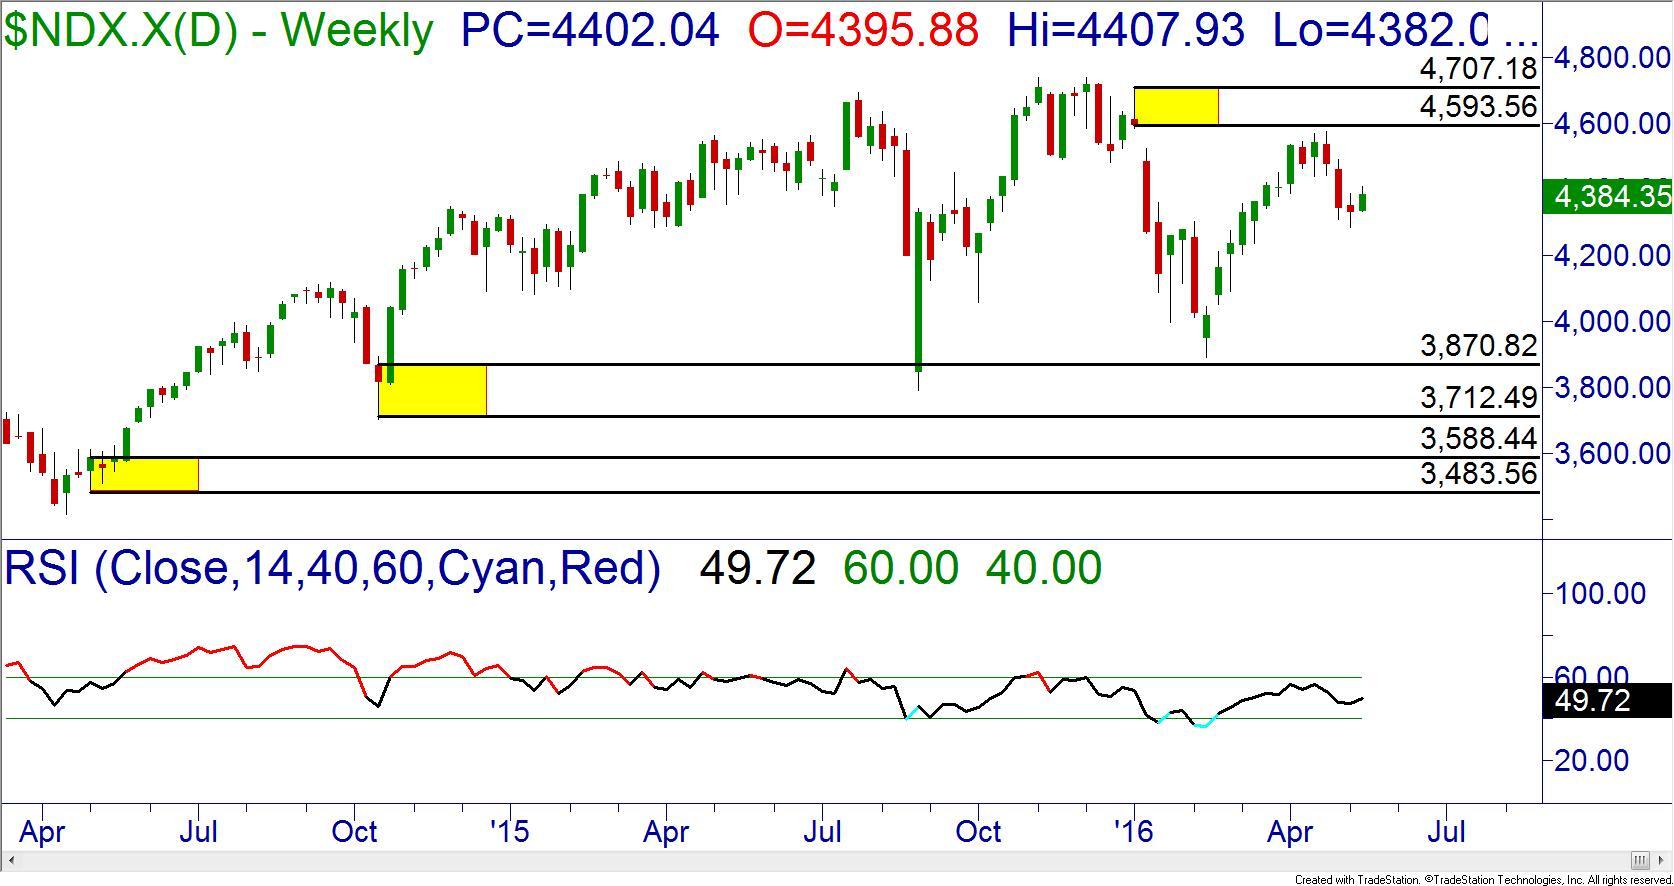
The Nasdaq 100 Index had been an incredibly strong index for some time, but it also failed shy of its supply zone on the weekly charts before dropping in price. The failure of the RSI to pierce 60 additionally suggests the continuation of the downtrend. The seasonal pattern of the tech heavy index is to, “Sell in May and go away.” With the calendar entering the traditional slow/bearish season for the Nasdaq, I would expect more price drops than rallies.
The mention of the seasonal pattern raises an interesting point. Most traders look myopically at the security they wish to trade. They ignore the outside influences that can affect their trades such as seasonal patterns and related securities that can increase your odds for success.
There are seasons for all securities:
-
Spring – Prices are starting their bullish rise.
-
Summer – The bull market and then the start of a slowdown and sideways consolidation
-
Autumn – Prices begin to fall
-
Wnter – The full bear market before the slowing and sideways consolidation
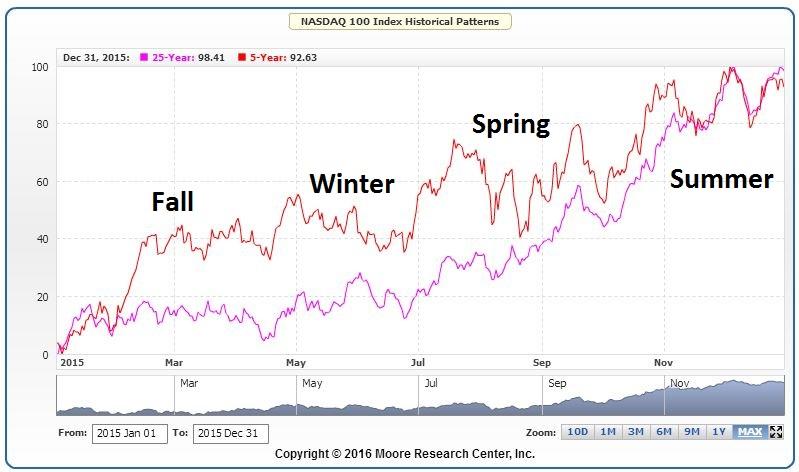
The chart above shows the seasonal pattern for the Nasdaq 100 index. The pink line is the averages of the index prices over the last 25 years while the red line shows it for the past five years. They are very similar but looking at the short term versus long can tell you if the pattern has been disrupted recently. The seasonal names, (spring, summer, autumn, winter), do not correlate to the calendar seasons. The spring for oil prices occurs in a different month than spring for the S&P 500. Oil will see prices rise when demand is strongest and drop when it is weakest.
The advantage of knowing seasonal patterns of the markets and securities we trade offers the longer term traders and investors a distinct advantage. When our weekly or monthly charts are approaching a supply or demand zone at the same time the season for that security is changing, we can increase our odds for successfully identifying the trend change. For example, if the season is contrary to the zones (approaching a supply zone in the spring season) we may break the zone instead of reversing.
The drawback to using seasonality is that there is a cost to obtain the information. Several services offer charts to identify the seasonal patterns for indexes and commodities for a fee. But if you can use this data to increase your profitability in the markets, it can be well worth it.
The seasonality should only be used to compliment Online Trading Academy’s core strategy. Trying to invest solely on seasonality could lead to losses. You improve your seasonal success by combining this analysis to what you already do on your long term charts. To learn what analysis is required, enroll in a course at your local center today.
Neither Freedom Management Partners nor any of its personnel are registered broker-dealers or investment advisers. I will mention that I consider certain securities or positions to be good candidates for the types of strategies we are discussing or illustrating. Because I consider the securities or positions appropriate to the discussion or for illustration purposes does not mean that I am telling you to trade the strategies or securities. Keep in mind that we are not providing you with recommendations or personalized advice about your trading activities. The information we are providing is not tailored to any individual. Any mention of a particular security is not a recommendation to buy, sell, or hold that or any other security or a suggestion that it is suitable for any specific person. Keep in mind that all trading involves a risk of loss, and this will always be the situation, regardless of whether we are discussing strategies that are intended to limit risk. Also, Freedom Management Partners’ personnel are not subject to trading restrictions. I and others at Freedom Management Partners could have a position in a security or initiate a position in a security at any time.
Editors’ Picks

EUR/USD holds firm near 1.1850 amid USD weakness
EUR/USD remains strongly bid around 1.1850 in European trading on Monday. The USD/JPY slide-led broad US Dollar weakness helps the pair build on Friday's recovery ahead of the Eurozone Sentix Investor Confidence data for February.

GBP/USD hovers near 1.3600 as UK government crisis weighs on Pound Sterling
GBP/USD moves sideways after registering modest gains in the previous session, trading around 1.3610 during the European hours on Monday. The pair could come under pressure as the Pound Sterling may weaken amid a fresh government crisis in the United Kingdom.

USD/JPY keeps the red below 157.00 on intervention risks
The Japanese Yen sticks to its modest intraday recovery gains against a broadly weaker US Dollar on the back of speculations that authorities will step in to stem weakness in the domestic currency. In fact, Japanese officials stepped up intervention warnings and confirmed close coordination with the US against disorderly FX moves. This, in turn, triggered an intraday USD/JPY turnaround from the 157.65 region, or a two-week top, touched in reaction to Prime Minister Sanae Takaichi's landslide win in Sunday's election.
Editors’ Picks
EUR/USD holds firm near 1.1850 amid USD weakness
EUR/USD remains strongly bid around 1.1850 in European trading on Monday. The USD/JPY slide-led broad US Dollar weakness helps the pair build on Friday's recovery ahead of the Eurozone Sentix Investor Confidence data for February.
USD/JPY keeps the red below 157.00 on intervention risks
The Japanese Yen sticks to its modest intraday recovery gains against a broadly weaker US Dollar on the back of speculations that authorities will step in to stem weakness in the domestic currency. In fact, Japanese officials stepped up intervention warnings and confirmed close coordination with the US against disorderly FX moves. This, in turn, triggered an intraday USD/JPY turnaround from the 157.65 region, or a two-week top, touched in reaction to Prime Minister Sanae Takaichi's landslide win in Sunday's election.

Gold remains supported by China's buying and USD weakness as traders eye US data
Gold struggles to capitalize on its intraday move up and remains below the $5,100 mark heading into the European session amid mixed cues. Data released over the weekend showed that the People's Bank of China extended its buying spree for a 15th month in January. Moreover, dovish US Fed expectations and concerns about the central bank's independence drag the US Dollar lower for the second straight day, providing an additional boost to the non-yielding yellow metal.

Cardano steadies as whale selling caps recovery
Cardano (ADA) steadies at $0.27 at the time of writing on Monday after slipping more than 5% in the previous week. On-chain data indicate a bearish trend, with certain whales offloading ADA. However, the technical outlook suggests bearish momentum is weakening, raising the possibility of a short-term relief rebound if buying interest picks up.

Japanese PM Takaichi nabs unprecedented victory – US data eyed this week
I do not think I would be exaggerating to say that Japanese Prime Minister Sanae Takaichi’s snap general election gamble paid off over the weekend – and then some. This secured the Liberal Democratic Party (LDP) an unprecedented mandate just three months into her tenure.
RECOMMENDED LESSONS
Making money in forex is easy if you know how the bankers trade!
I’m often mystified in my educational forex articles why so many traders struggle to make consistent money out of forex trading. The answer has more to do with what they don’t know than what they do know. After working in investment banks for 20 years many of which were as a Chief trader its second knowledge how to extract cash out of the market.
5 Forex News Events You Need To Know
In the fast moving world of currency markets where huge moves can seemingly come from nowhere, it is extremely important for new traders to learn about the various economic indicators and forex news events and releases that shape the markets. Indeed, quickly getting a handle on which data to look out for, what it means, and how to trade it can see new traders quickly become far more profitable and sets up the road to long term success.
Top 10 Chart Patterns Every Trader Should Know
Chart patterns are one of the most effective trading tools for a trader. They are pure price-action, and form on the basis of underlying buying and selling pressure. Chart patterns have a proven track-record, and traders use them to identify continuation or reversal signals, to open positions and identify price targets.
7 Ways to Avoid Forex Scams
The forex industry is recently seeing more and more scams. Here are 7 ways to avoid losing your money in such scams: Forex scams are becoming frequent. Michael Greenberg reports on luxurious expenses, including a submarine bought from the money taken from forex traders. Here’s another report of a forex fraud. So, how can we avoid falling in such forex scams?
What Are the 10 Fatal Mistakes Traders Make
Trading is exciting. Trading is hard. Trading is extremely hard. Some say that it takes more than 10,000 hours to master. Others believe that trading is the way to quick riches. They might be both wrong. What is important to know that no matter how experienced you are, mistakes will be part of the trading process.
The challenge: Timing the market and trader psychology
Successful trading often comes down to timing – entering and exiting trades at the right moments. Yet timing the market is notoriously difficult, largely because human psychology can derail even the best plans. Two powerful emotions in particular – fear and greed – tend to drive trading decisions off course.