“There’s a sucker born every minute!” You are likely familiar with this phrase which has been attributed to the late P.T. Barnum. It means that there are a lot of gullible people in the world. Wall Street is counting on investor vulnerability in order to line their own pockets.
Business television helps to perpetuate this. Most of the time, when you tune in you are bombarded with “news” of the hottest stocks; the ones that have already increased in price. This entices the general public to buy stocks at inflated prices. Who do you think is selling them these stocks?
When making the decision to join a trend, it is helpful to know who is behind that trend. For instance, if price is being pushed higher by novice traders it may not be wise to join them. However, if the buying pressure is being created by institutional trading there is a higher probability for it to continue.
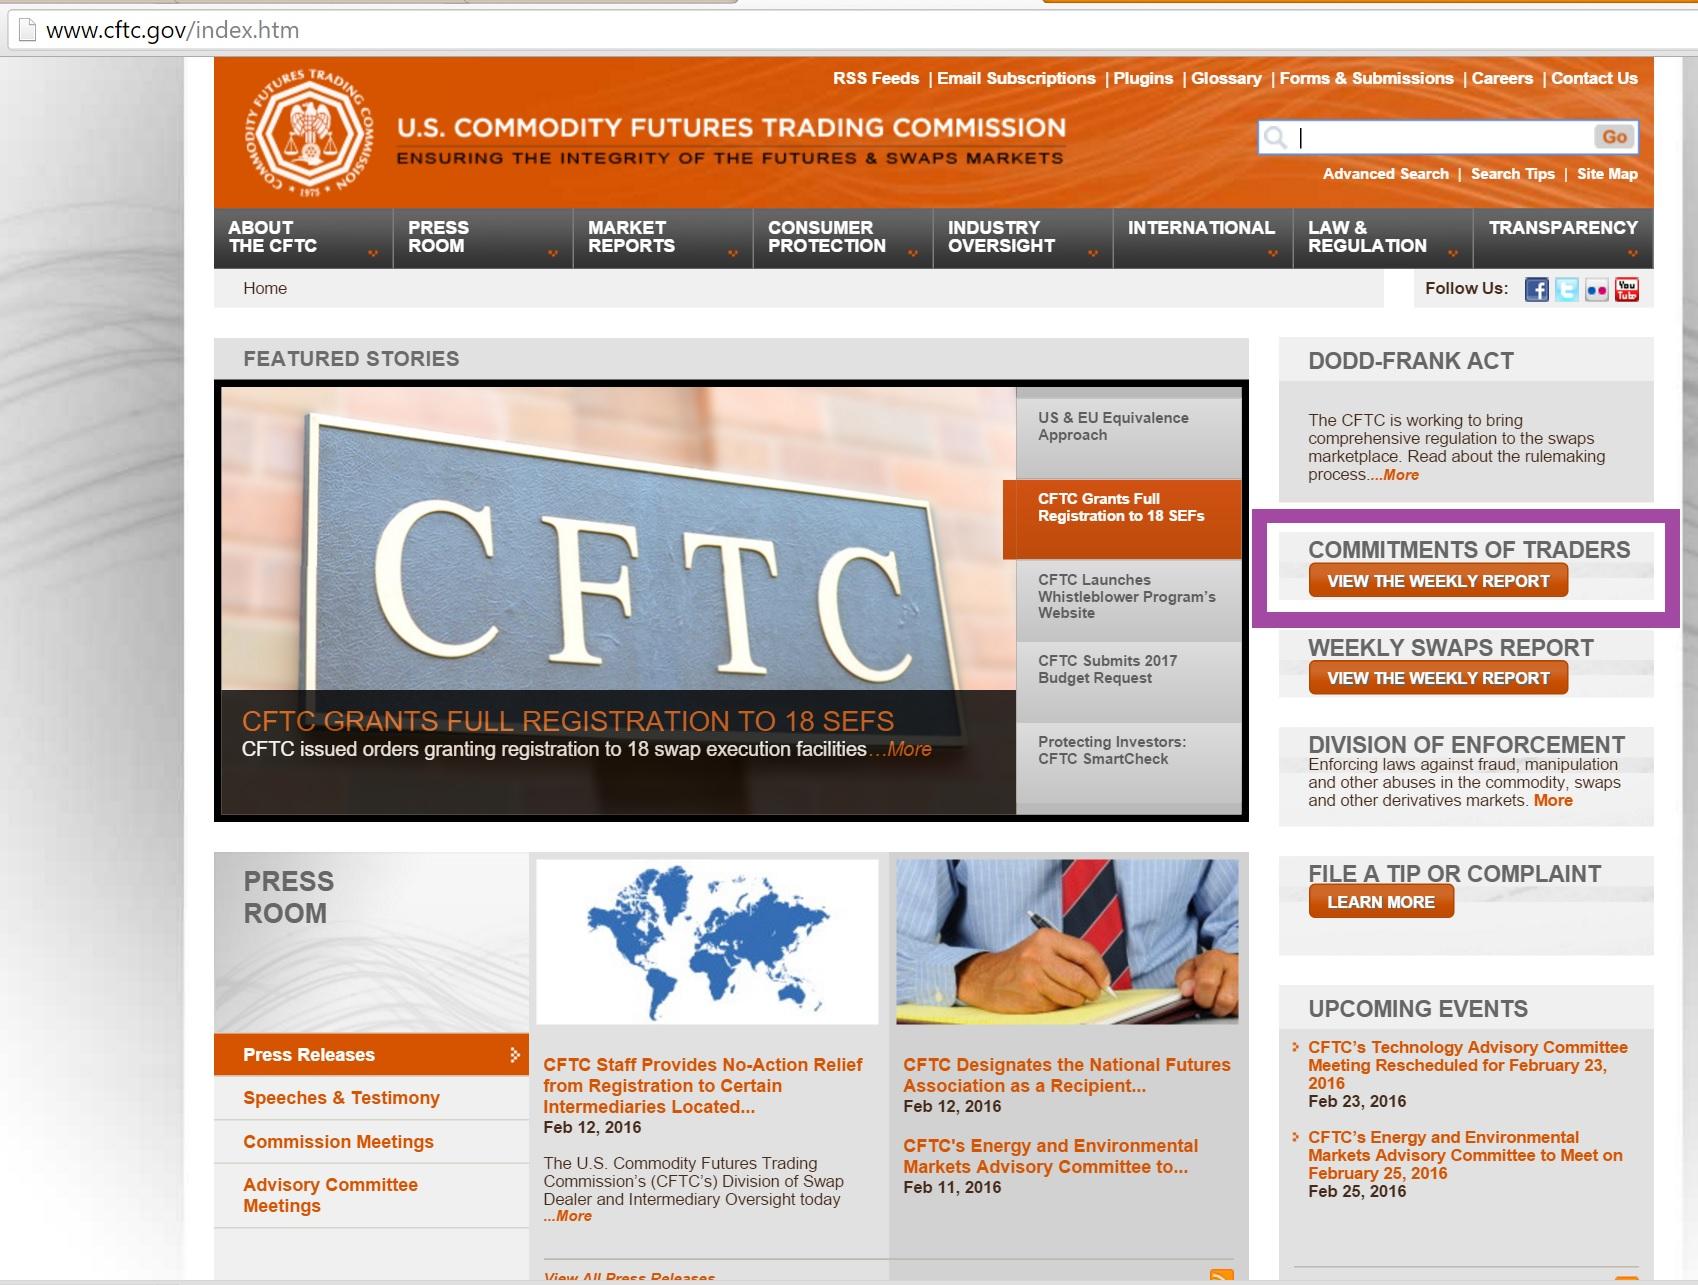
The Commitment of Traders report (commonly referred to as the COT) has been published by the Commodity Futures Trading Commission since 1962 and provides information on the open interest of futures contracts. The COT report is published every Friday and contains the data from the previous Tuesday. A futures contract is a derivative which gets its value from an underlying asset. They are traded to either profit from future values of the asset or to hedge a position in the asset against a drop in price. The COT shows open interest in a multitude of commodity, currency and stock index futures.
Open interest differs from volume in that volume is the number of contracts actually traded per day, while open interest is the number of contracts entered into, either long or short, that have not been offset by transactions or exercise. They are new or open contracts which may offer clues as to what the traders are anticipating price to do in the asset. This information can be used to assist us in our own trading decisions whether we are trading currency, commodities, futures, options or even stocks.
The COT breaks down open longs and shorts into three categories. We have the Commercials, the non-Commercials and the Non-Reportables. The Commercials are people or businesses who deal directly with the underlying asset such as farmers, miners and international businesses. With commodity futures, they understand the true supply and demand of the asset and are trying to hedge against future price movement that could hurt operating profits. They are not usually trying to profit from the futures contract itself. Stock index futures are used to hedge institutional portfolios and for arbitrage opportunities. The non-commercials are large speculators and can represent “smart money”. They are speculating on the future movement of the trend in the underlying asset. The non-reportable positions are the so called “dumb money”. They are the small individual traders trying to play the direction of the markets for profit, and they are often wrong.
The COT provides the open interest for both longs and shorts for all three categories of traders. Subtract the net shorts from the net longs in each category to see if the commercials, non-commercials and small traders are net long or net short. To use the COT data, you should keep a chart of the data and see what the trend is for the three groups. This is not the simplest task as you will have to manually enter the data each week from the COT report, but it can be beneficial to do so. Are the traders going net long or net short? Are they increasing their longs or their shorts? To trade with the trend, follow the non-commercials. Remember, this is the “smart money” that seeks to profit from price movement in the futures contract. If they are net short and increasing their shorts, look to go short yourself. If they are net long and increasing their net longs, look to open longs as well.
The most powerful trading signal comes when the commercials and non-commercials are trending in one direction while the non-reportables or speculators (small traders) are trending in the opposite. The divergence of these groups shows the professionals taking money from the public and you should follow the professionals for greater probability of success.
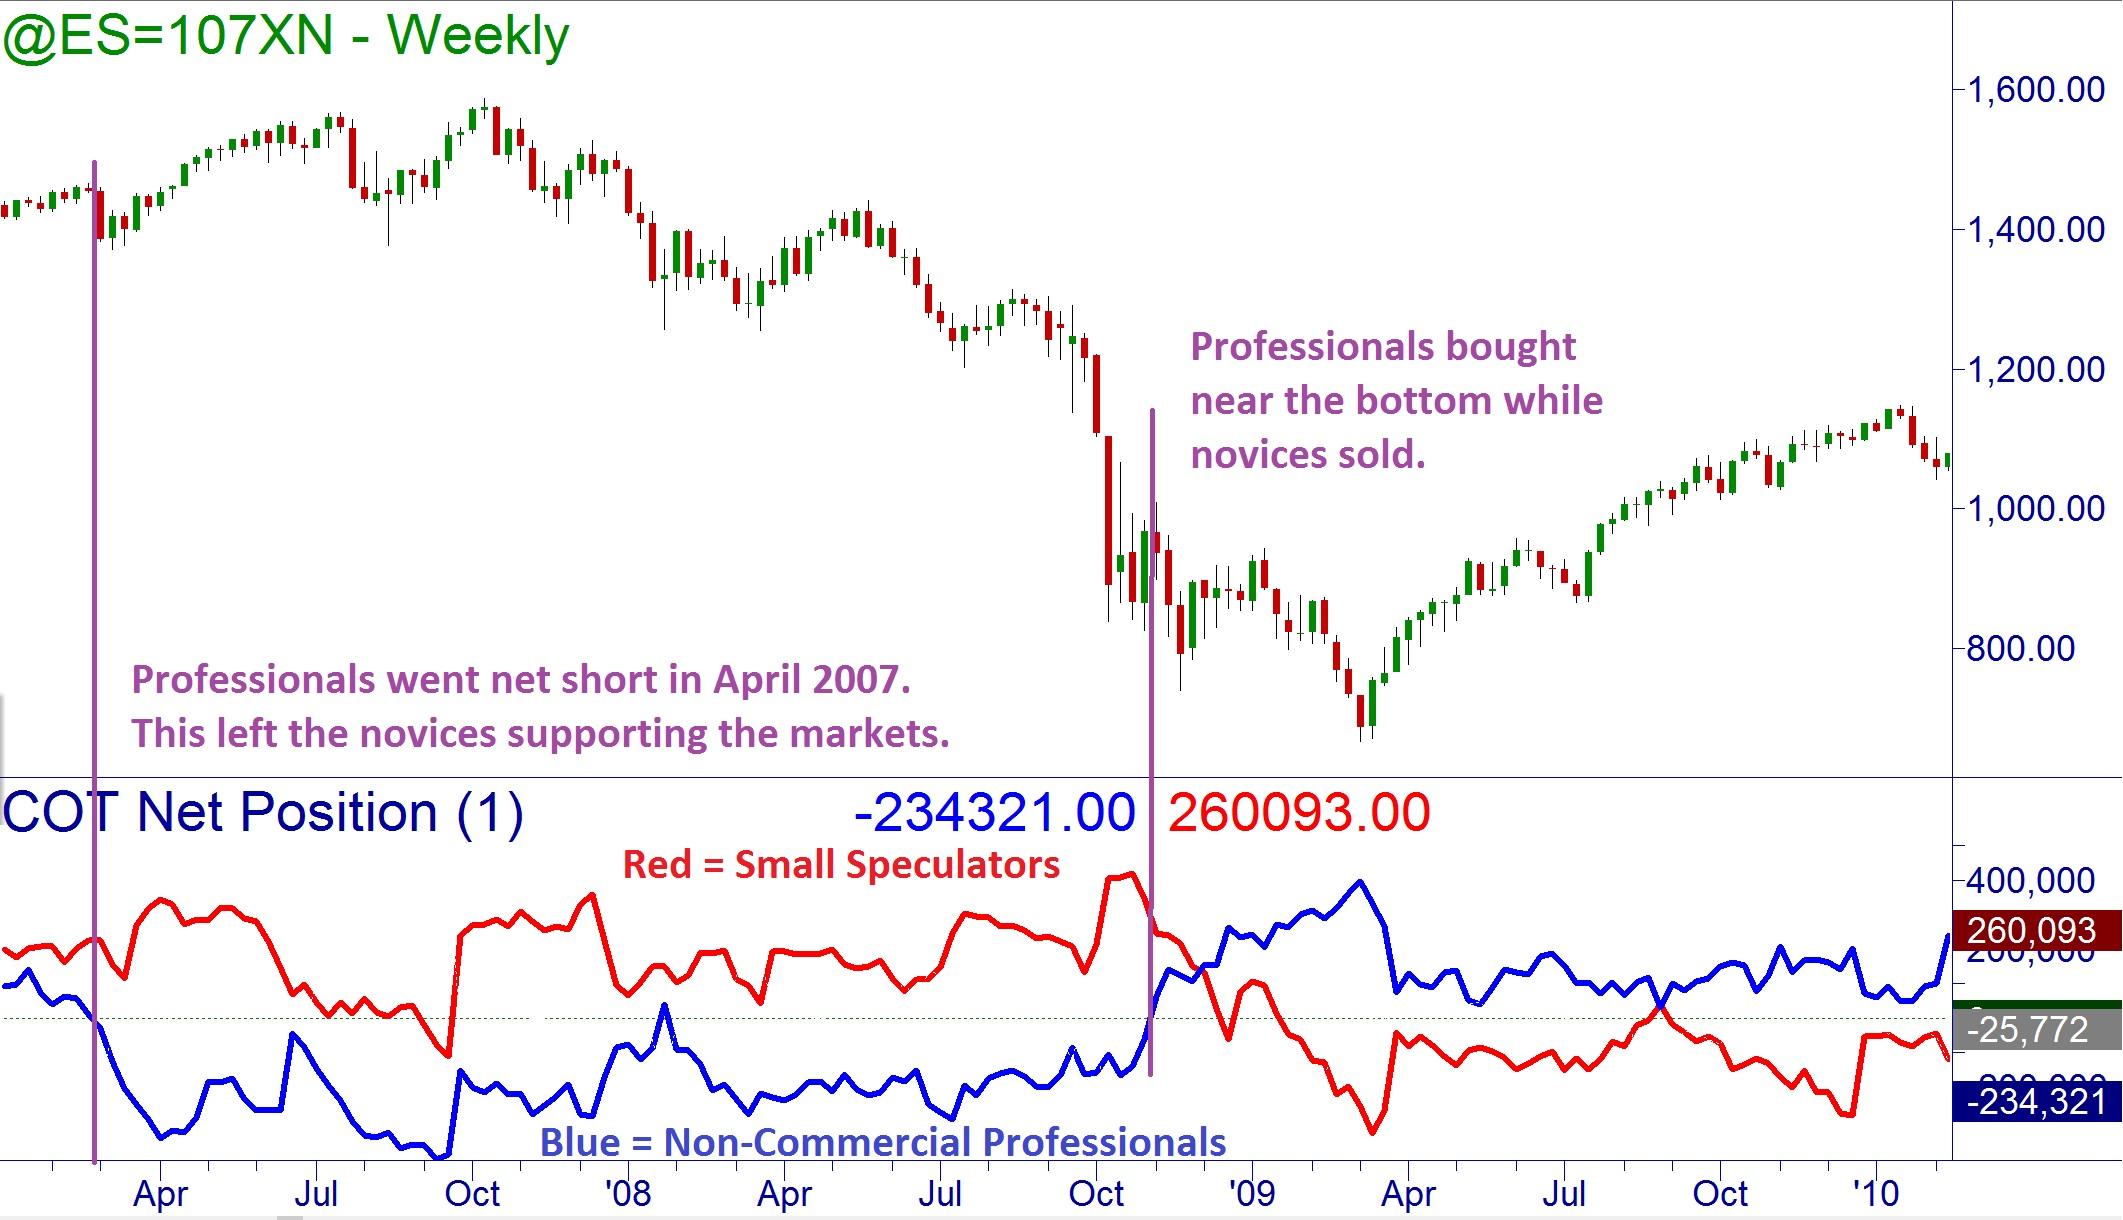
The following chart is from TradeStation and shows the S&P 500 Futures on a weekly chart with the COT Net Position as an indicator below. Looking at the divergences may indicate possible trend changes. The professionals all sold ahead of the market peak in October 2007 while the amateurs continued to buy. A similar picture was painted in early 2009 when the professionals bought ahead of the market bottom while many traders sold off into the decline.
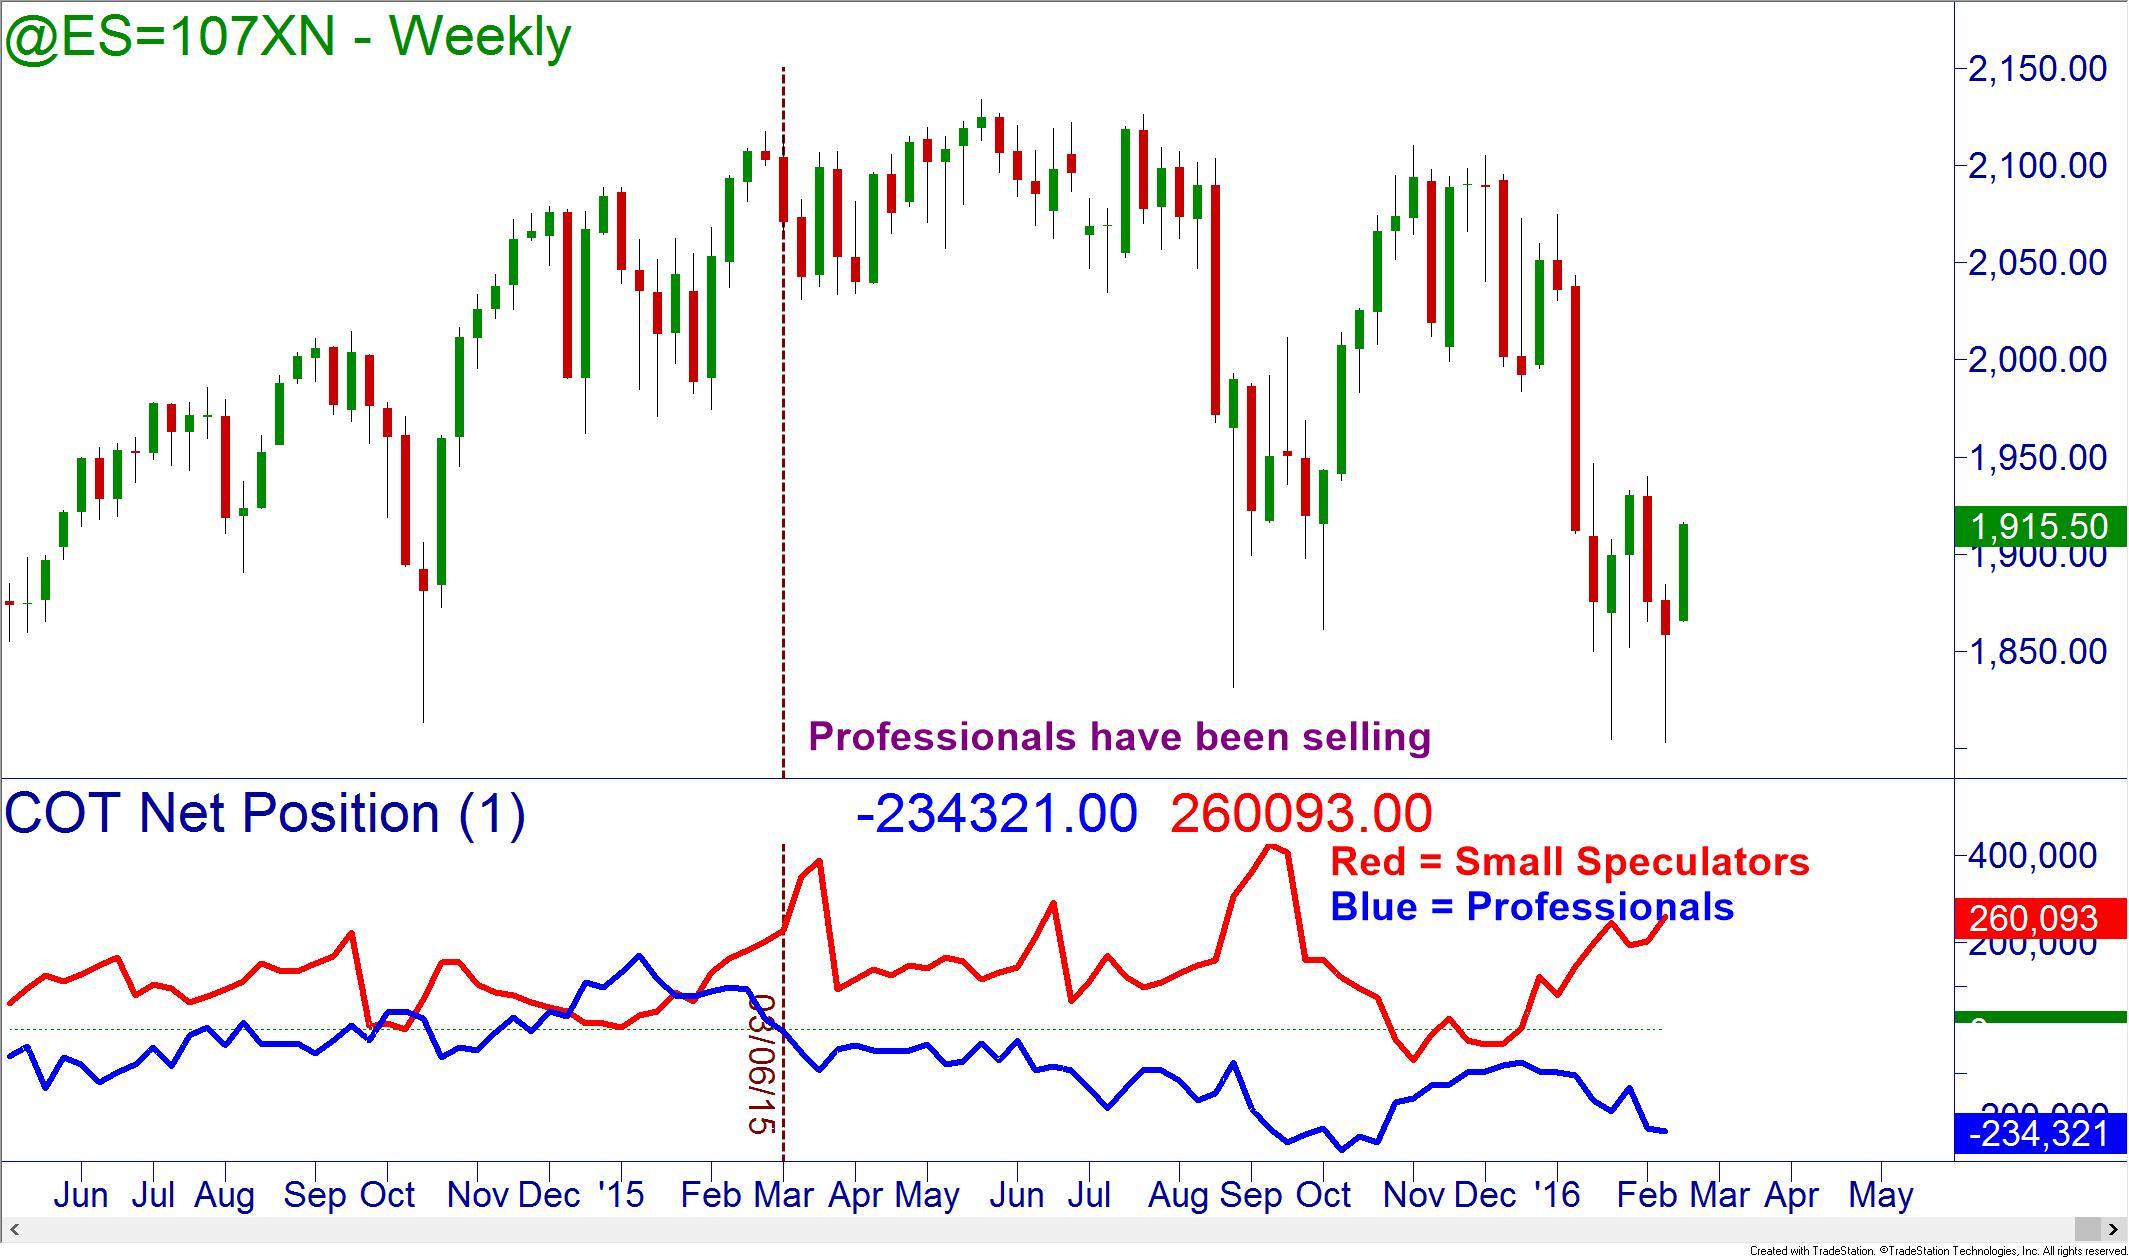
Looking at the current market environment, the S&P 500 rally has been fueled by the small speculators; that includes novice traders. This is not what you want to see if the trend is to last. The Non-Commercial professionals have been exiting the equity markets since the highs in spring 2015, leaving the novices holding the bag.
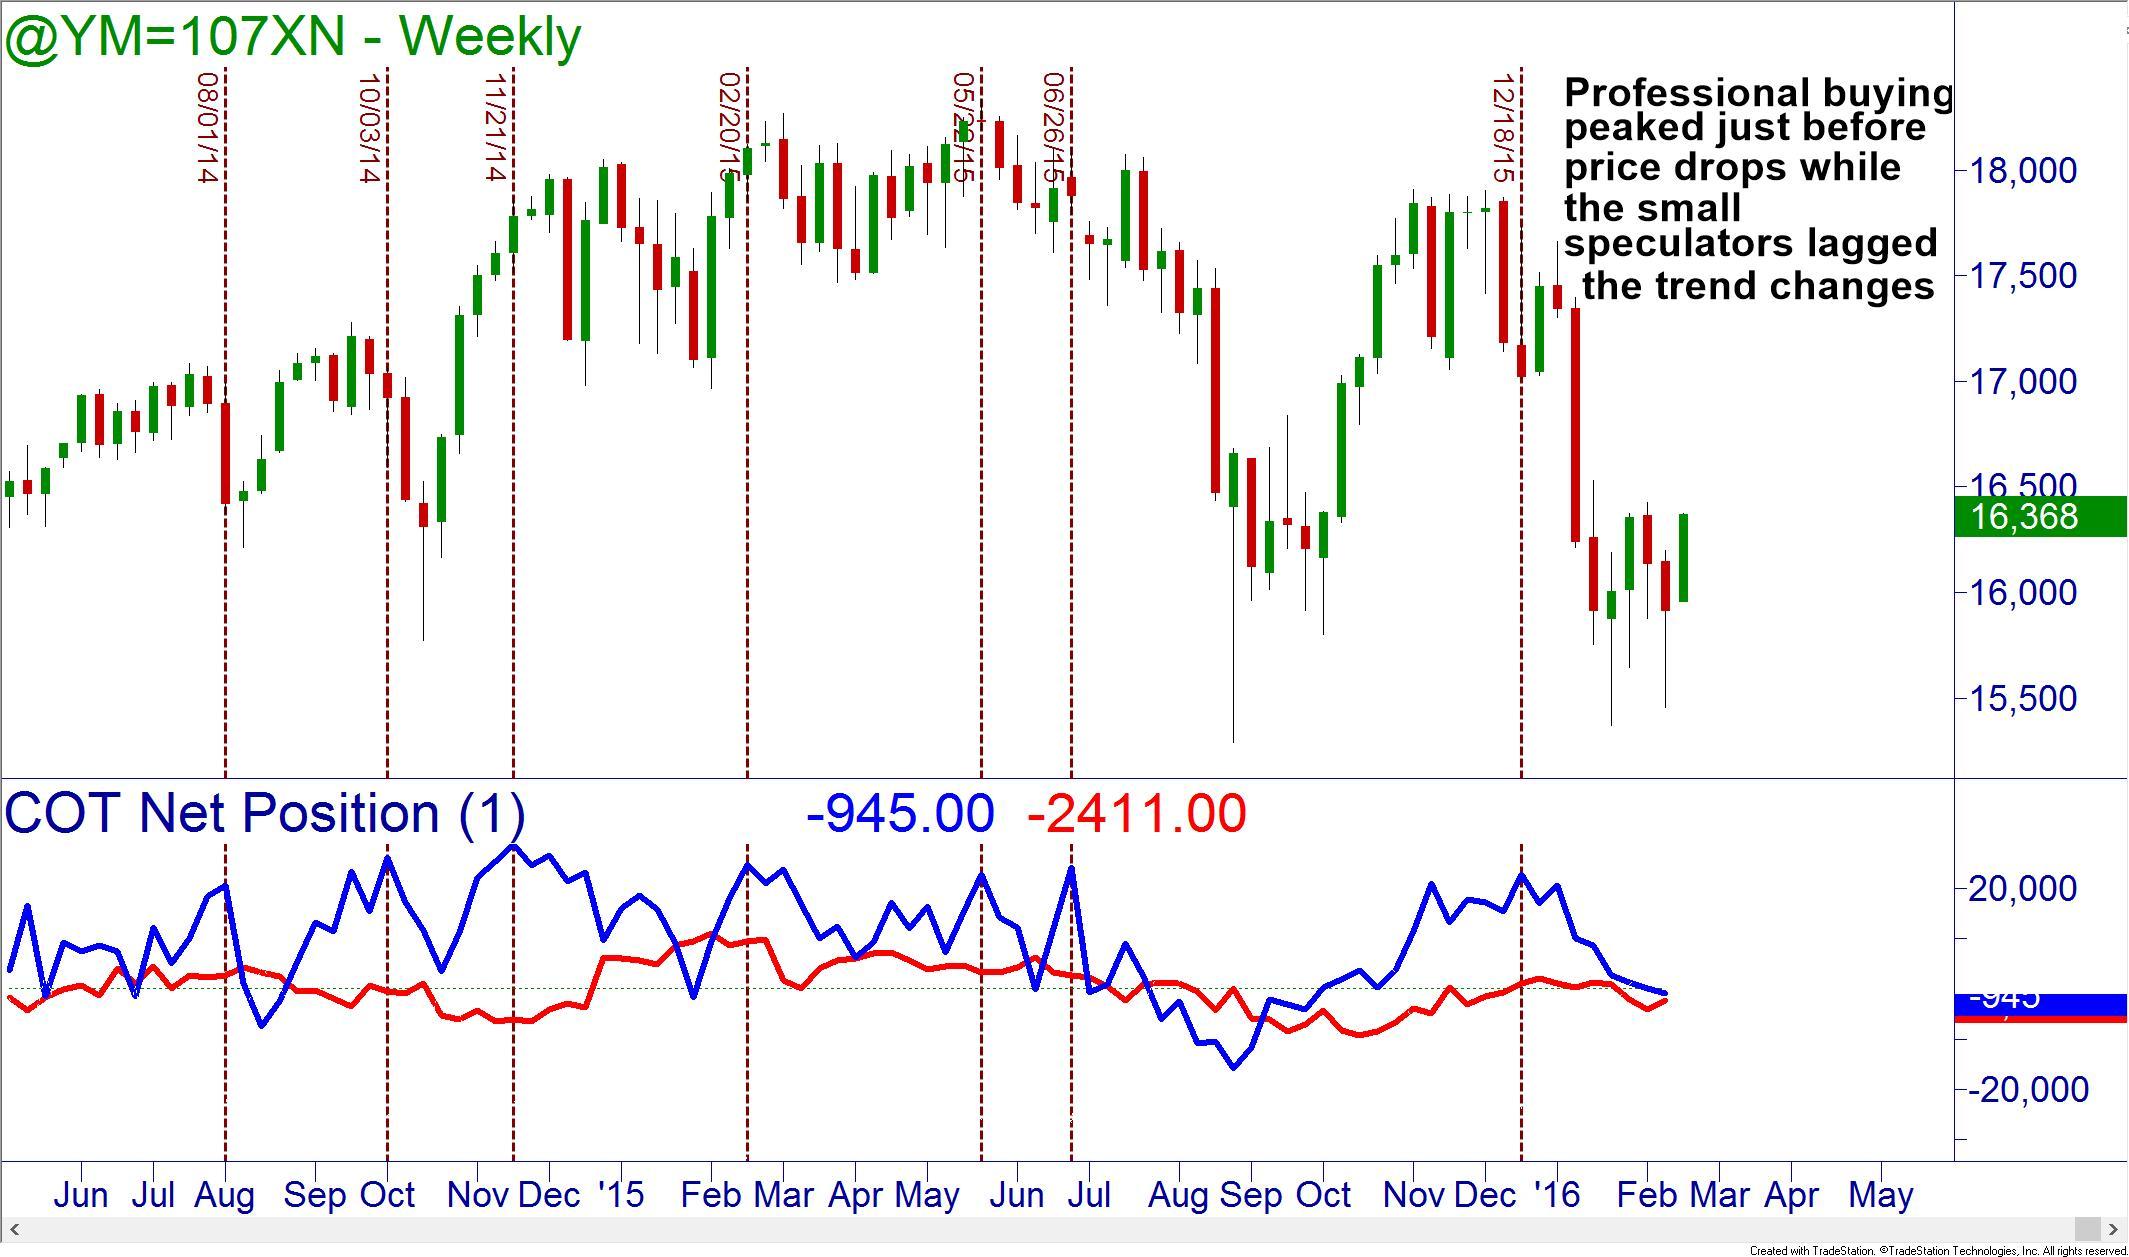
The COT for the Dow is not as dramatic but is still telling. Notice, as the non-commercial professionals peak in their long activity prices soon drop. The small speculators are often lagging the trend change and are on the wrong side of the market.
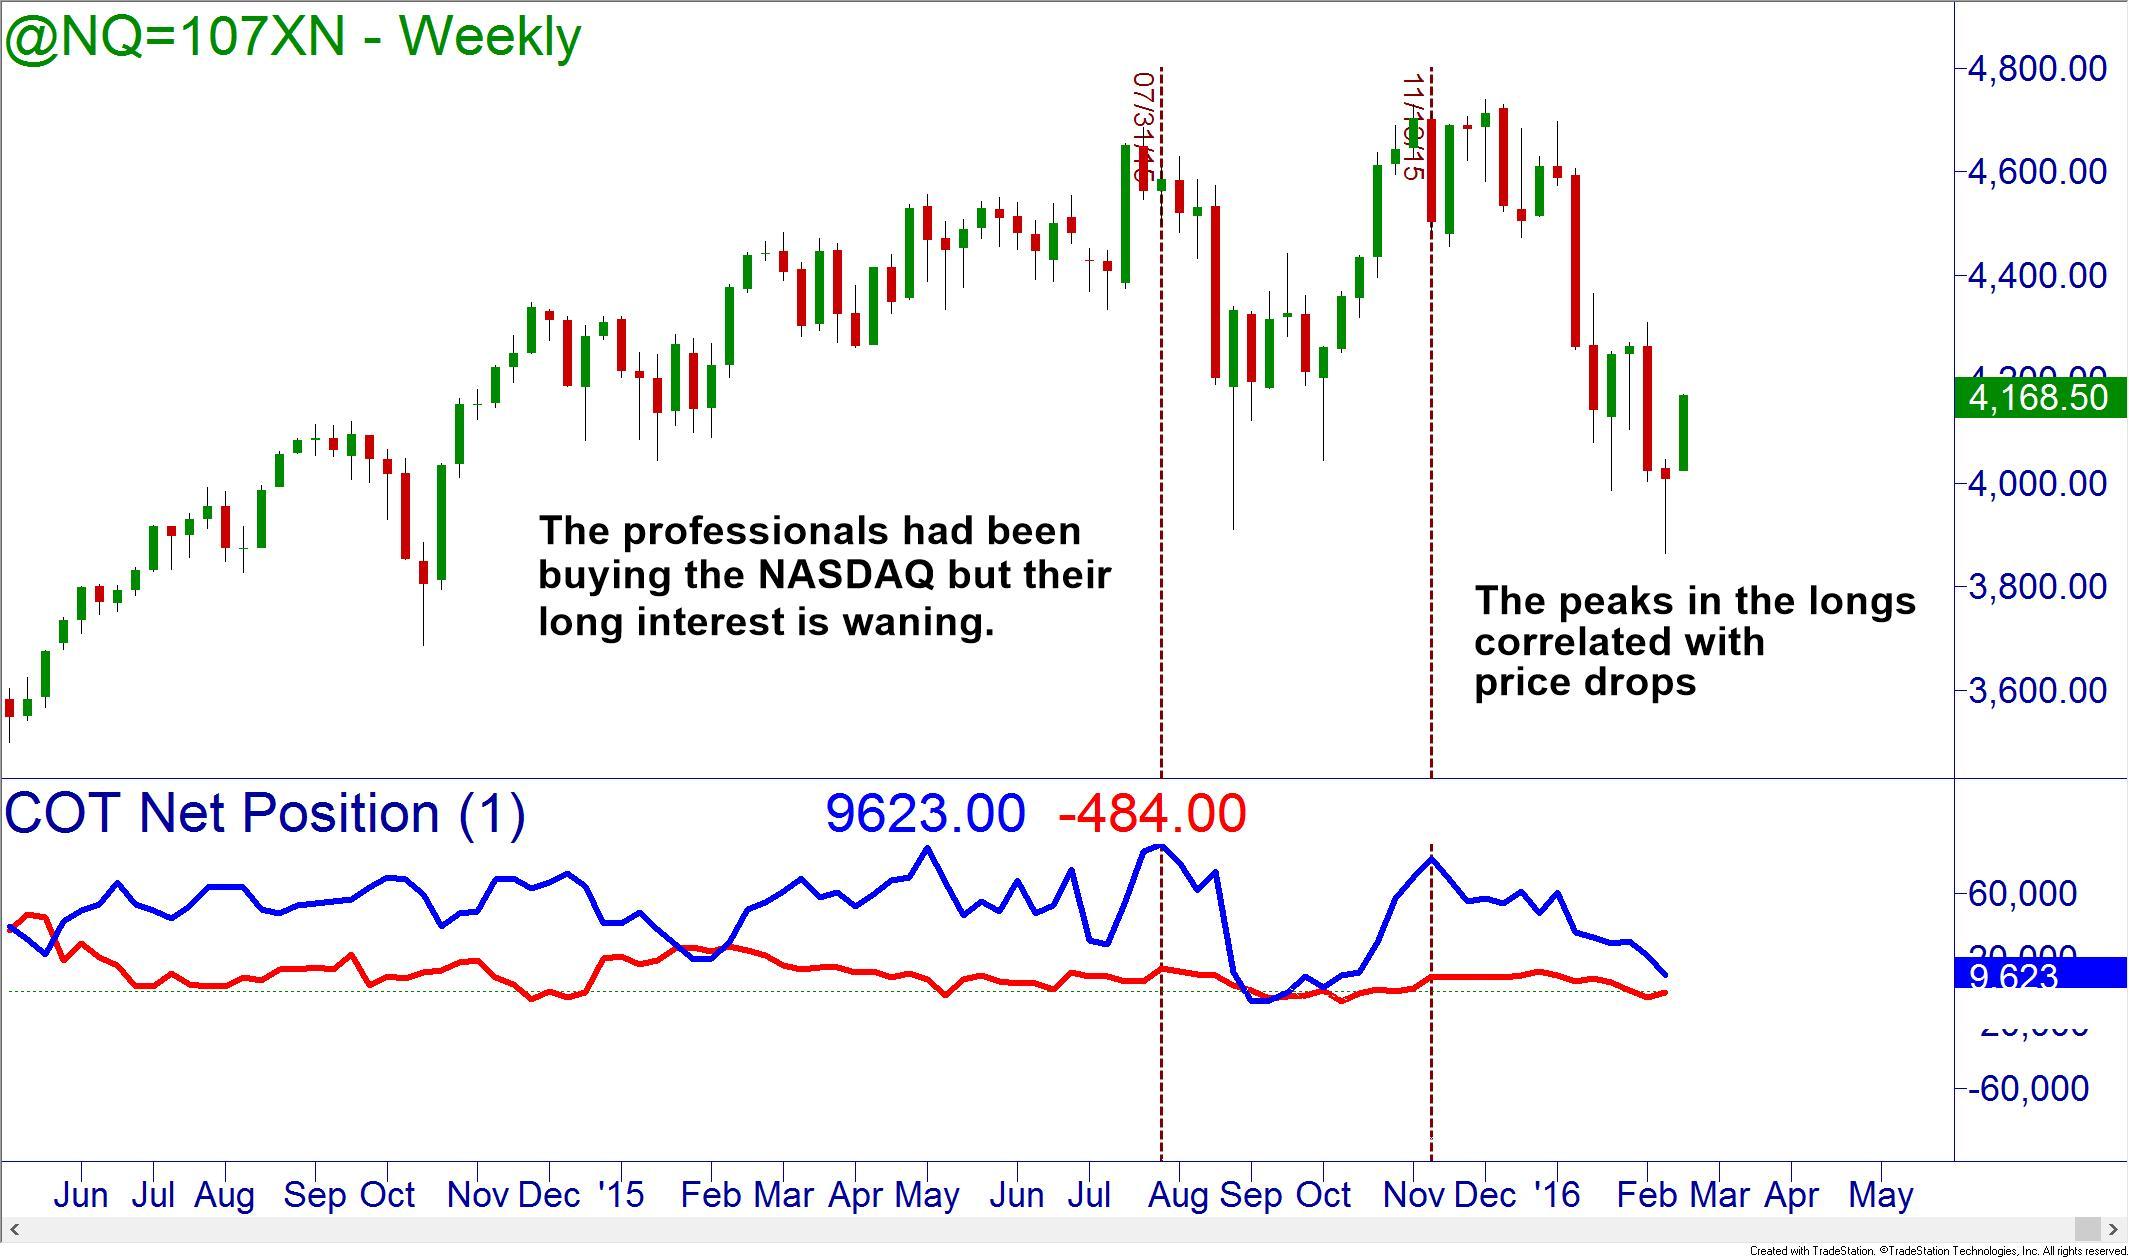
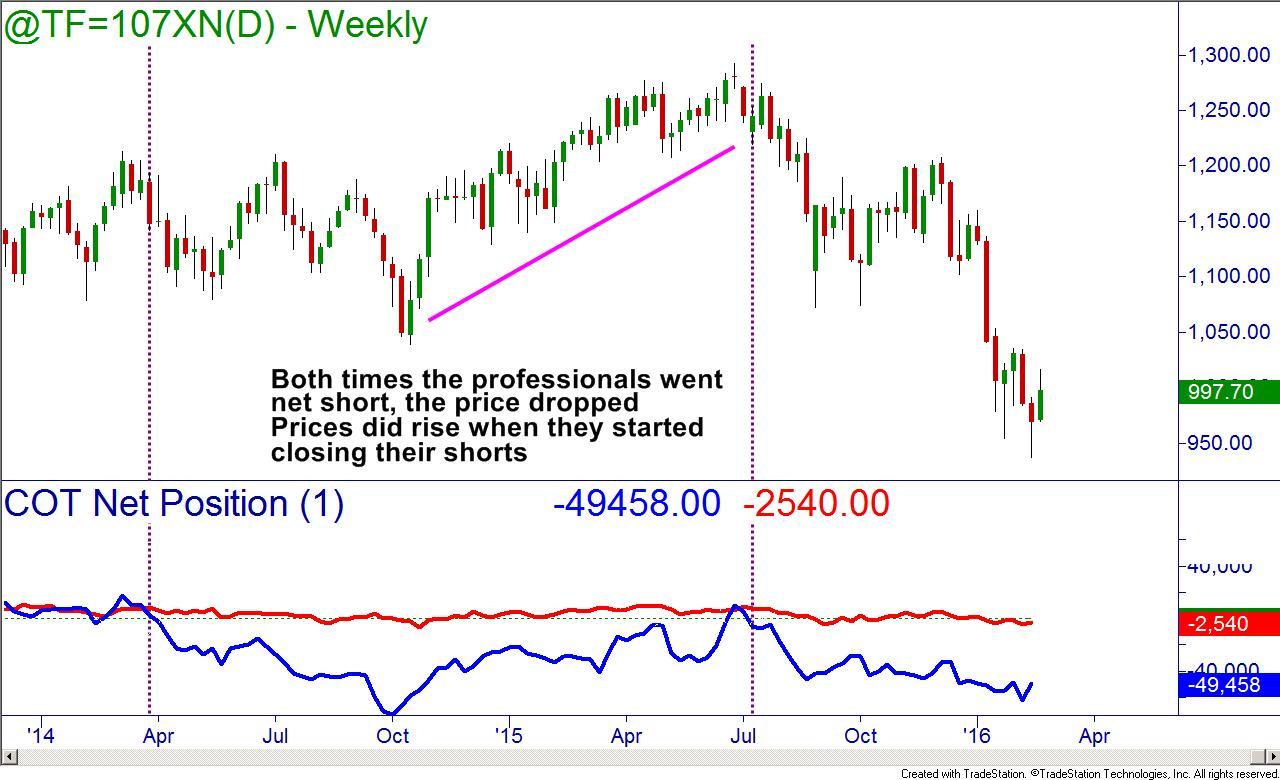
The markets have been led by buying in the NASDAQ and the Russell 2000. Looking at both of those COTs, we see the exodus of professionals from those index futures too. This shows they do not have faith in the current bullish rally.
Use the COT to monitor open interest; watching the markets and also the smart money carefully will lead the way. We are nearing a critical breaking point on the US and even world markets. Worries about sovereign debt, fed bailout programs ending, possible negative interest rates ahead, etc. are weighing on everyone’s mind. If you are unsure what to do in this type of market environment, get educated. Volatile markets are not scary if you have knowledge. In fact, they can be extremely profitable; just trade in the direction that the markets and the big boys tell us to.
Neither Freedom Management Partners nor any of its personnel are registered broker-dealers or investment advisers. I will mention that I consider certain securities or positions to be good candidates for the types of strategies we are discussing or illustrating. Because I consider the securities or positions appropriate to the discussion or for illustration purposes does not mean that I am telling you to trade the strategies or securities. Keep in mind that we are not providing you with recommendations or personalized advice about your trading activities. The information we are providing is not tailored to any individual. Any mention of a particular security is not a recommendation to buy, sell, or hold that or any other security or a suggestion that it is suitable for any specific person. Keep in mind that all trading involves a risk of loss, and this will always be the situation, regardless of whether we are discussing strategies that are intended to limit risk. Also, Freedom Management Partners’ personnel are not subject to trading restrictions. I and others at Freedom Management Partners could have a position in a security or initiate a position in a security at any time.
Editors’ Picks

USD/JPY gathers strength to near 157.50 as Takaichi’s party wins snap elections
The USD/JPY pair attracts some buyers to around 157.45 during the early Asian session on Monday. The Japanese Yen weakens against the US Dollar after Japan’s ruling Liberal Democratic Party won an outright majority in Sunday’s lower house election, opening the door to more fiscal stimulus by Prime Minister Sanae Takaichi.

EUR/USD: US Dollar to remain pressured until uncertainty fog dissipates
Unimpressive European Central Bank left monetary policy unchanged for the fifth consecutive meeting. The United States first-tier employment and inflation data is scheduled for the second week of February. EUR/USD battles to remain afloat above 1.1800, sellers moving to the sidelines.

Gold: Volatility persists in commodity space
After losing more than 8% to end the previous week, Gold remained under heavy selling pressure on Monday and dropped toward $4,400. Although XAU/USD staged a decisive rebound afterward, it failed to stabilize above $5,000. The US economic calendar will feature Nonfarm Payrolls and Consumer Price Index data for January, which could influence the market pricing of the Federal Reserve’s policy outlook and impact Gold’s performance.

Crypto Today: Bitcoin, Ethereum, XRP rebound amid risk-off, $2.6 billion liquidation wave
US NFP and CPI data awaited after Warsh’s nomination as Fed chief. Yen traders lock gaze on Sunday’s snap election. UK and Eurozone Q4 GDP data also on the agenda. China CPI and PPI could reveal more weakness in domestic demand.

Three scenarios for Japanese Yen ahead of snap election Premium
The latest polls point to a dominant win for the ruling bloc at the upcoming Japanese snap election. The larger Sanae Takaichi’s mandate, the more investors fear faster implementation of tax cuts and spending plans.
RECOMMENDED LESSONS
Making money in forex is easy if you know how the bankers trade!
I’m often mystified in my educational forex articles why so many traders struggle to make consistent money out of forex trading. The answer has more to do with what they don’t know than what they do know. After working in investment banks for 20 years many of which were as a Chief trader its second knowledge how to extract cash out of the market.
5 Forex News Events You Need To Know
In the fast moving world of currency markets where huge moves can seemingly come from nowhere, it is extremely important for new traders to learn about the various economic indicators and forex news events and releases that shape the markets. Indeed, quickly getting a handle on which data to look out for, what it means, and how to trade it can see new traders quickly become far more profitable and sets up the road to long term success.
Top 10 Chart Patterns Every Trader Should Know
Chart patterns are one of the most effective trading tools for a trader. They are pure price-action, and form on the basis of underlying buying and selling pressure. Chart patterns have a proven track-record, and traders use them to identify continuation or reversal signals, to open positions and identify price targets.
7 Ways to Avoid Forex Scams
The forex industry is recently seeing more and more scams. Here are 7 ways to avoid losing your money in such scams: Forex scams are becoming frequent. Michael Greenberg reports on luxurious expenses, including a submarine bought from the money taken from forex traders. Here’s another report of a forex fraud. So, how can we avoid falling in such forex scams?
What Are the 10 Fatal Mistakes Traders Make
Trading is exciting. Trading is hard. Trading is extremely hard. Some say that it takes more than 10,000 hours to master. Others believe that trading is the way to quick riches. They might be both wrong. What is important to know that no matter how experienced you are, mistakes will be part of the trading process.
The challenge: Timing the market and trader psychology
Successful trading often comes down to timing – entering and exiting trades at the right moments. Yet timing the market is notoriously difficult, largely because human psychology can derail even the best plans. Two powerful emotions in particular – fear and greed – tend to drive trading decisions off course.
