The Elliott Waves Theory consists of different cycles of various degrees that complement each other and defines the way a currency pair moves. While Elliott based the original theory on the way the stock market moved, it works on any financial product. To know how to trade with Elliott, you must understand the logical process behind the theory.
While I'm strictly trading Price Action, the Elliott way of looking at markets help understanding where price is and where it will go next. Again- this is done solely for educational purposes and not to recommend a trading strategy.
If there's a chart, there's a way to count the waves. However, there's a catch!
Traders need historical data. Before counting waves with the Elliott Waves Theory, make sure you get your hands on as much historical data as you can. Also, make sure the data is coming from a reliable source.
Think of it for a second. Just open a chart on any currency pair you want, on any broker. Then, go on the monthly time frame.
Look at the data offered for the most popular pairs. Take the GBPUSD for example. The data usually goes back to the late 90's.
What does this mean? The Great Britain Pound (GBP) didn't exist earlier? Or the U.S. Dollar? Of course, they did. Only, the broker doesn't show the data.
Now, there are various reasons for this. Some may be legitimate, some not. In the end, it doesn't really matter.
What matters, is for traders to find that data before counting impulsive or corrective waves with Elliott. The only way to know how to trade with Elliott is to know where the market is. Only historical data gives you access to super-cycles, as defined by Elliott. That is why I have chosen to trade with one partner that I can trust.
How to Trade with Elliott – Impulsive Waves Types
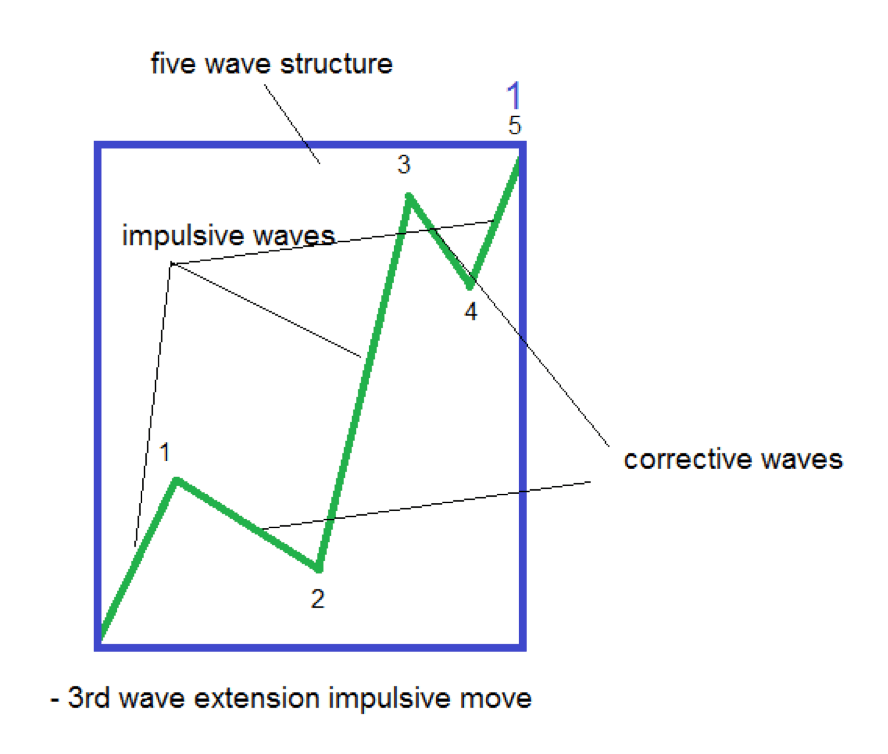
An Elliott Waves cycle consists of an impulsive and a corrective move. An impulsive wave is a five-wave structure. Moreover, Elliott used numbers to show the impulsive activity.
A bullish impulsive wave shows a five-wave structure that rises. Even within these five waves, two show corrective activity. They are corrective waves of a lower degree, and, together with the other three impulsive waves, form the five-wave structure Elliott discovered.
But the market makes various moves. Traders struggle to distinguish between impulsive and corrective waves. That is because even some corrective waves have at least one impulsive wave of a lower degree.
However, the aim of this article is to focus on impulsive waves. Everyone knows the third wave is the longest wave in the structure. But this is not the general rule and not the way the Forex market these days moves.
3rd Wave Extension Impulsive Waves
As a rule of thumb, Elliott noticed that in any impulsive wave, at least on wave extends. This represents the so-called "litmus test".
In plain English, one wave must be the longest. Or, it must stand out of the crowd.
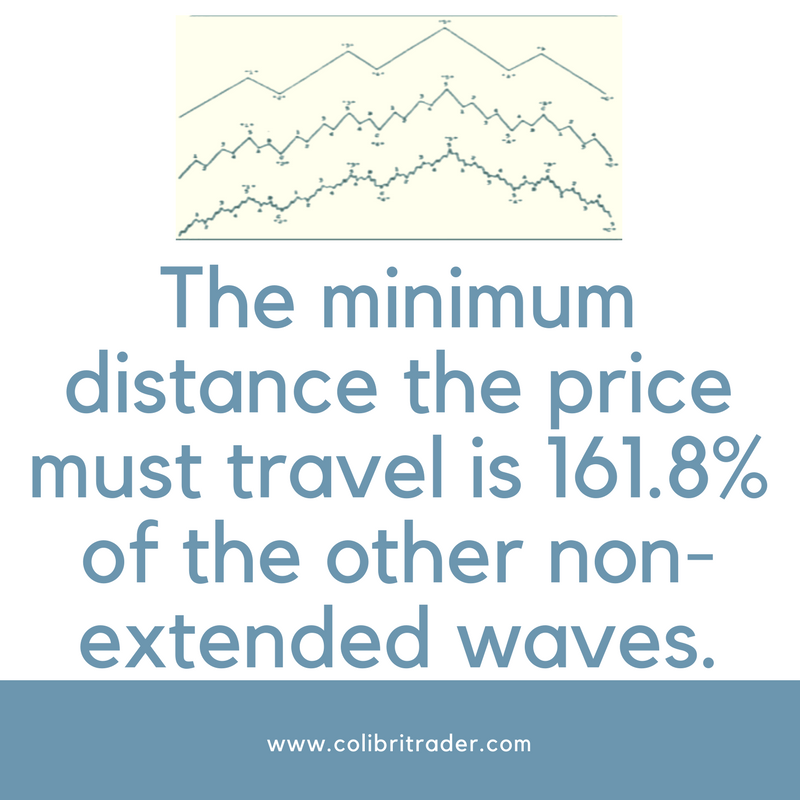
NOTE: In mathematical terms, the minimum distance the price must travel is 161.8% of the other non-extended waves.
The key here is to understand that the extension refers only to the impulsive waves of a lower degree, within the impulsive wave of a bigger one. Namely, only to the 3rd, 1st and 5th waves in a five-wave structure.
Out of these three possibilities, the 3rd wave is the most likely to extend. A 3rd wave extension impulsive wave forms most of the times.
Few traders understand the true nature of an extended wave.
Important: The 161.8% distance is the MINIMUM distance the price MUST travel. It can move way beyond that level.
Because the 3rd has the biggest chances to extend, traders use the length of the 1st wave to find the minimum distance the price travels. For that, they use either:
-
The Fibonacci Retracement tool. Click and drag from the start until the end of the 1st wave, then measure the distance from 0 to 161.8%. Apply that distance from the end of the 2nd wave to find out the minimum target for the 3rd
-
The Fibonacci Expansion tool. Click at the start of the 1st wave, at its end and at the end of the 2nd The projected 161.8% level shows the minimum target.
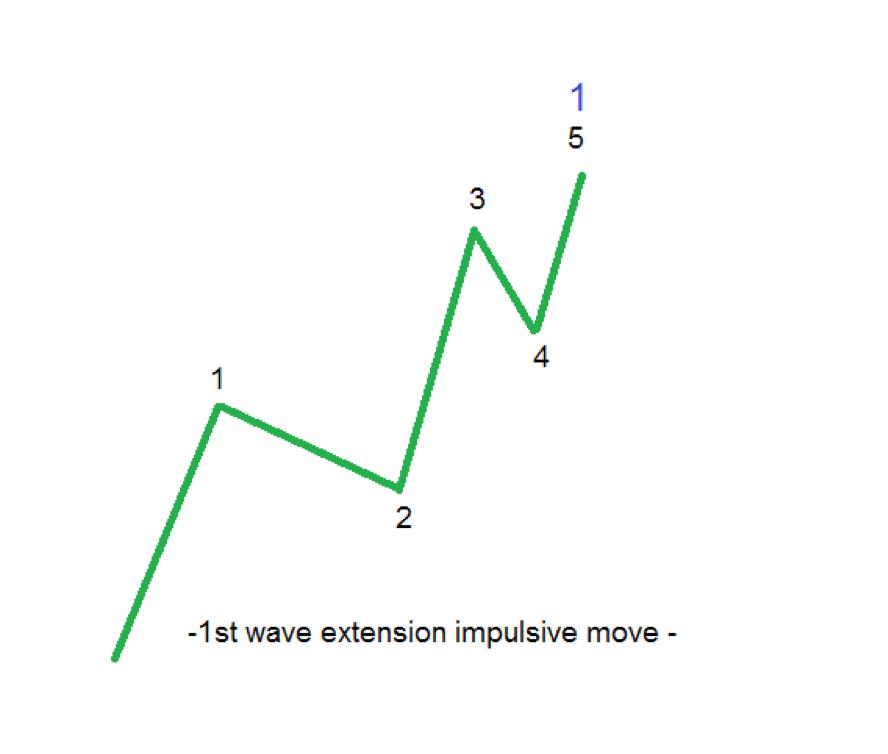
1st Wave Extension Impulsive Waves
The next possibility is for the price to form a 1st wave extension. These extended waves form often on today's Forex market.
In such a structure, the 1st wave stands out of the crowd. It is bigger than the 3rd and the 5th waves. These two are the so-called non-extended waves.
However, one of the most important Elliott rules states that the 3rd wave cannot be the shortest. Hence, we have the structure of this impulsive move.
Usually, the 2nd wave is the most time-consuming in such a pattern. At the same time, the 5th wave is the shortest one both in time and in price.
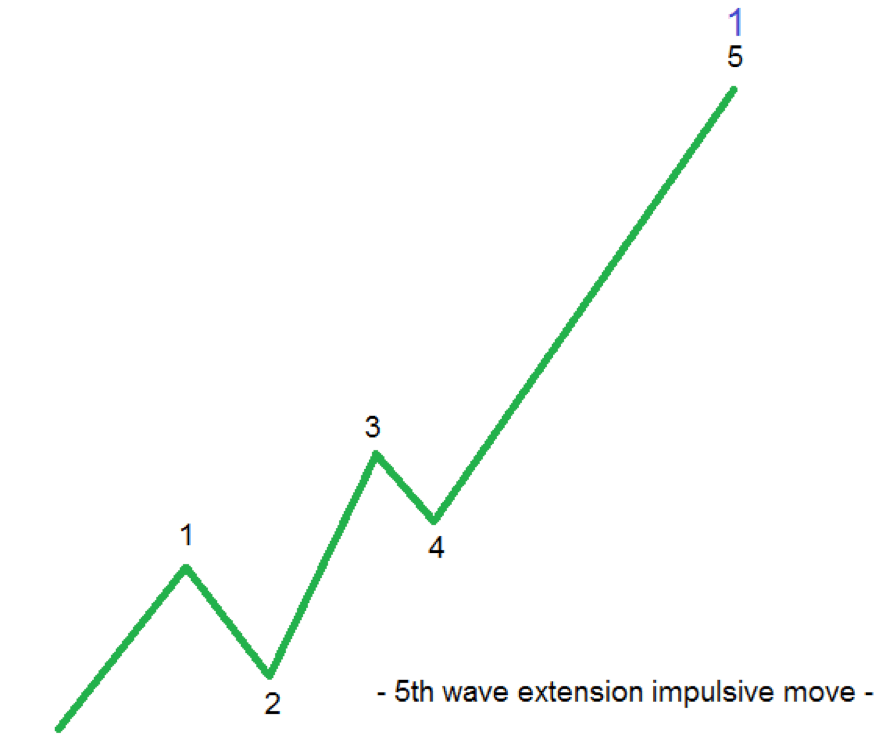
5th Wave Extension Impulsive
Waves
If you know how to trade with Elliott Waves, you know this is a rare possibility even in the Forex market. When a 5th wave extension forms, it can only be the c-wave in a flat pattern.
In principle, it can appear in other places, but in reality, they only appear as part of a flat. Even in this case, traders will end up misinterpreting the move.
The 5th wave is the biggest, the 3rd wave is not the shortest, and this makes the 1st wave the smallest one. For this reason, traders confuse this impulsive wave with a corrective one.
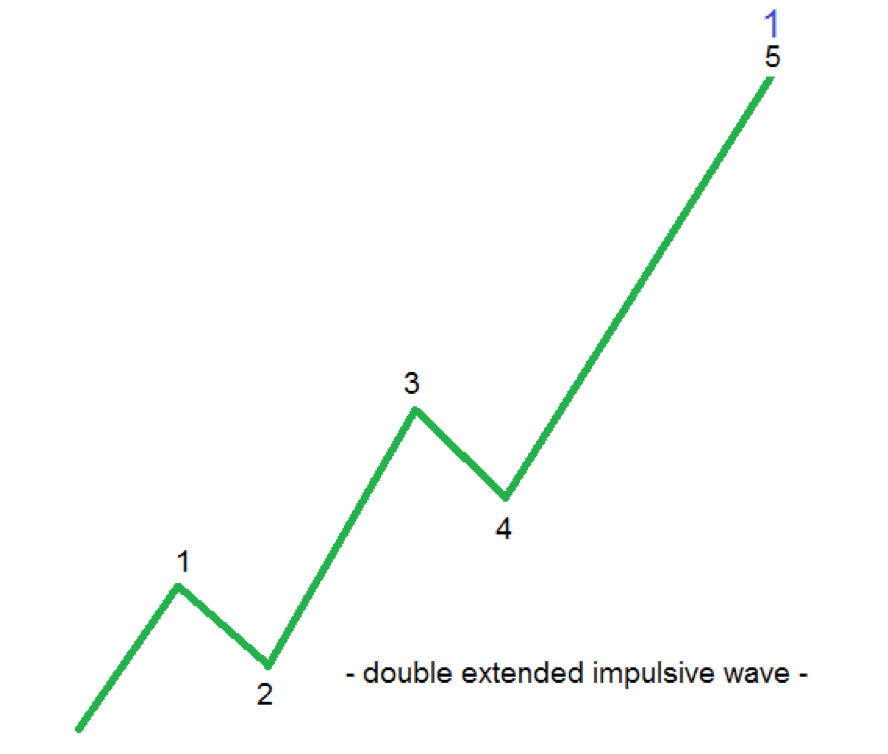
Double Extended Impulsive Waves
Perhaps the trickiest impulsive wave type forms when two waves extend. The only possibility for this to happen is when:
-
The 3rd wave exceeds 161.8% of the 1st
-
The 5th wave exceeds 161.8% of the 3rd
Both conditions happen in the same five-wave structure. By the time the impulsive move ends, traders will scratch their heads not knowing what just happened.
Conclusion
To the surprise of many, when it moves, the market mostly forms corrective waves. Not impulsive ones.
However, within the corrective waves, there's plenty of impulsive activity. For example, in a zigzag, there are two impulsive waves. That makes a triple zigzag to have six different impulsive waves connected by little or no drawdown.
What I'm trying to say is that when you see an impulsive wave forming, most likely it comes as part of a corrective wave. Yet, knowing the possibilities for the patterns to form, keeps you on the right side of the market.
This material is written for educational purposes only. By no means do any of its contents recommend, advocate or urge the buying, selling or holding of any financial instrument whatsoever. Trading and Investing involves high levels of risk. The author expresses personal opinions and will not assume any responsibility whatsoever for the actions of the reader. The author may or may not have positions in Financial Instruments discussed in this newsletter. Future results can be dramatically different from the opinions expressed herein. Past performance does not guarantee future results.
Editors’ Picks

EUR/USD meets initial support around 1.1800
EUR/USD remains on the back foot, although it has managed to reverse the initial strong pullback toward the 1.1800 region and regain some balance, hovering around the 1.1850 zone as the NA session draws to a close on Tuesday. Moving forward, market participants will now shift their attention to the release of the FOMC Minutes and US hard data on Wednesday.

GBP/USD bounces off lows, retargets 1.3550
After bottoming out just below the 1.3500 yardstick, GBP/USD now gathers some fresh bids and advances to the 1.3530-1.3540 band in the latter part of Tuesday’s session. Cable’s recovery comes as the Greenback surrenders part of its advance, although it keeps the bullish bias well in place for the day.

USD/JPY is looking for direction around 153.00 with key US data in focus
USD/JPY reversal from 153.70 has been contained above 152.70 on Tuesday. Major currencies are trading within narrow ranges amid thin trading volumes. Investors await the release of the US GDP and PCE Inflation figures to make decisions.
Editors’ Picks

NZD/USD: All eyes on RBNZ guidance and new Governor Breman's debut
NZD/USD opened Tuesday at 0.60344, reached a high of 0.60520 and a low of 0.60044, and closed at 0.60480, down 0.22%. The pair is holding well above the 50-day Exponential Moving Average at 0.59041 and the 200-day EMA at 0.58545, with both averages rising and spaced roughly 50 pips apart, confirming the underlying bullish trend that began from the January low of 0.57110.

AUD/USD extends the bounce, focus back to 0.7100
AUD/USD adds to Monday’s optimism and approaches the key 0.7100 barrier ahead of the opening bell in Asia. The pair’s positive performance comes as investors keep assessing the hawkish tilt from the RBA Minutes and despite humble gains in the Greenback. Next in Oz will be the Westpac Leading Index and the Wage Price Index.

Gold remains offered below $5,000
Gold stays on the defensive on Tuesday, receding to the sub-$5,000 region per troy ounce on the back of the persistent move higher in the Greenback. The precious metal’s decline is also underpinned by the modest uptick in US Treasury yields across the spectrum.

RBNZ set to pause interest-rate easing cycle as new Governor Breman faces firm inflation
The Reserve Bank of New Zealand remains on track to maintain the Official Cash Rate at 2.25% after concluding its first monetary policy meeting of this year on Wednesday.

UK jobs market weakens, bolstering rate cut hopes
In the UK, the latest jobs report made for difficult reading. Nonetheless, this represents yet another reminder for the Bank of England that they need to act swiftly given the collapse in inflation expected over the coming months.
RECOMMENDED LESSONS
Making money in forex is easy if you know how the bankers trade!
I’m often mystified in my educational forex articles why so many traders struggle to make consistent money out of forex trading. The answer has more to do with what they don’t know than what they do know. After working in investment banks for 20 years many of which were as a Chief trader its second knowledge how to extract cash out of the market.
5 Forex News Events You Need To Know
In the fast moving world of currency markets where huge moves can seemingly come from nowhere, it is extremely important for new traders to learn about the various economic indicators and forex news events and releases that shape the markets. Indeed, quickly getting a handle on which data to look out for, what it means, and how to trade it can see new traders quickly become far more profitable and sets up the road to long term success.
Top 10 Chart Patterns Every Trader Should Know
Chart patterns are one of the most effective trading tools for a trader. They are pure price-action, and form on the basis of underlying buying and selling pressure. Chart patterns have a proven track-record, and traders use them to identify continuation or reversal signals, to open positions and identify price targets.
7 Ways to Avoid Forex Scams
The forex industry is recently seeing more and more scams. Here are 7 ways to avoid losing your money in such scams: Forex scams are becoming frequent. Michael Greenberg reports on luxurious expenses, including a submarine bought from the money taken from forex traders. Here’s another report of a forex fraud. So, how can we avoid falling in such forex scams?
What Are the 10 Fatal Mistakes Traders Make
Trading is exciting. Trading is hard. Trading is extremely hard. Some say that it takes more than 10,000 hours to master. Others believe that trading is the way to quick riches. They might be both wrong. What is important to know that no matter how experienced you are, mistakes will be part of the trading process.
The challenge: Timing the market and trader psychology
Successful trading often comes down to timing – entering and exiting trades at the right moments. Yet timing the market is notoriously difficult, largely because human psychology can derail even the best plans. Two powerful emotions in particular – fear and greed – tend to drive trading decisions off course.