Non-Farm Payrolls: Which brokers could keep it tight?

PROFILE:
• Current Job: Head of Business Development at Trade Proofer
• Career: Passionate about forex trading since college. Co-founder of Trade Proofer community.
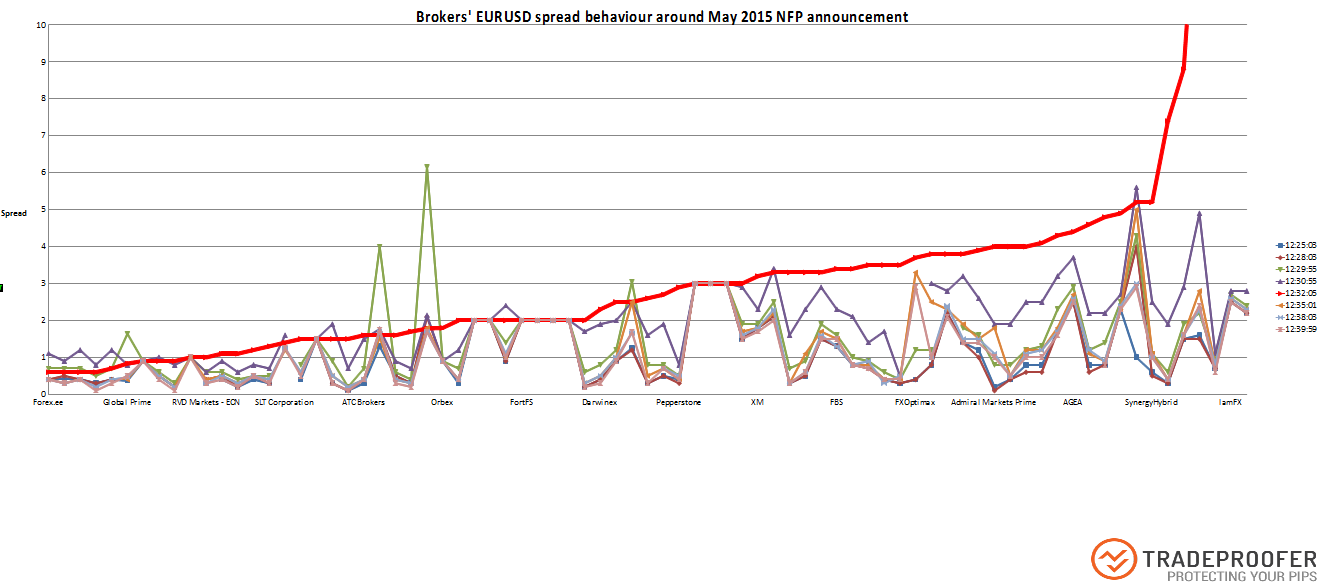
The chart shows how several brokers' EURUSD spreads looked at-around the NFP announcement, time is in GMT. The red line represents the most scrambled situation at 12:32, when aggregated spreads got the widest. The brokers are ordered by their 12:32 spreads, thus tightest brokers are on the left, least competitive brokers are on the right. Apparently, some brokers decided to sit on the bench until situation calmed down.
Limitations apply, however. Commissions are not taken into account so the chart does not reflect overall competitiveness of brokers, but rather an impression on how spread volatility unfolded and how particular brokers handle economic events. Also, a competitive quote doesn’t mean competitive fill price. Slippage due to low liquidity and/or latency is frequent especially around such events.
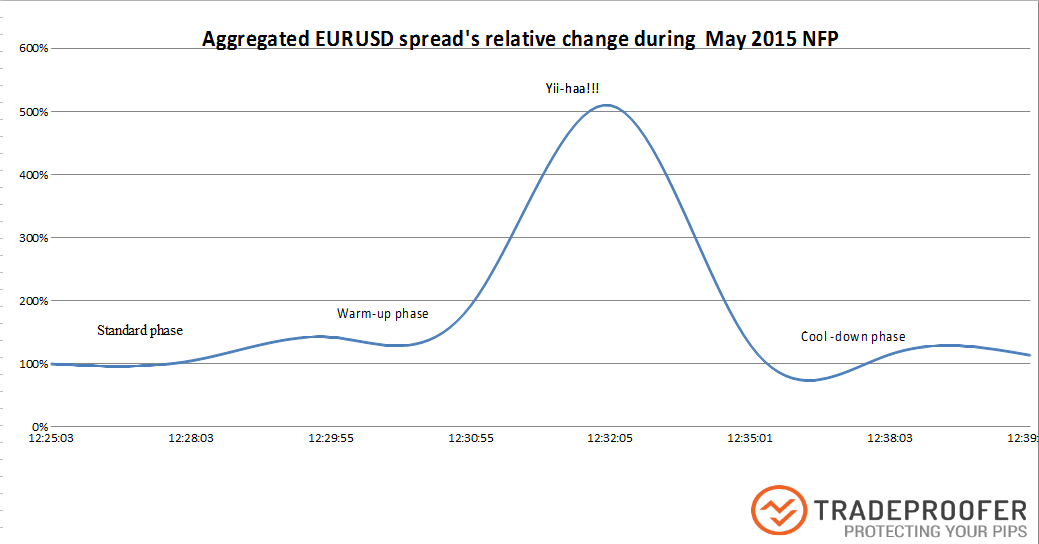
The next chart shows how EURSD spreads got somewhat wider right before the economic event, how they sky-rocketed right after the announcement and how they consolidated after a couple of minutes at a slightly higher level. The y axis shows the actual aggregated spread of 90+ brokers expressed in percentage of its 12:25 value. In plain English, the peak around 500% means that the monitored 90+ brokers’ spreads got 5x wider at the busiest time.
Author

FXStreet Team
FXStreet
Composed of a group of economic journalists and FX experts, the FXStreet content team produces and oversees all content published on FXStreet. It provides a purely journalistic approach to the Forex market.
More from FXStreet Team
















