How to trade a 'dead cat bounce'

In a recent post, we defined what the “Dead cat bounce” phenomenon is. In short, it is a term used when a market manages to muster a temporary rebound within a prolonged period of downside. A dead cat bounce is typically considered a price pattern, while it can also be explained as the repositioning of market participants, by closing short positions to lock profits, on the assumption that market has reached its bottom. Hence they then flip to the long side of the market, on the belief that the market is oversold and it’s time to move up.
In this post we will now elaborate how to trade this phenomenon. However before we go through the “dead cat bounce” strategy, we need to once again highlight that a dead cat bounce can be seen both in the broader economy, such as during the depths of a recession, or it can be seen in the price of an individual stock or group of stocks. However it is difficult to predict beforehand.
Is it possible to trade it?
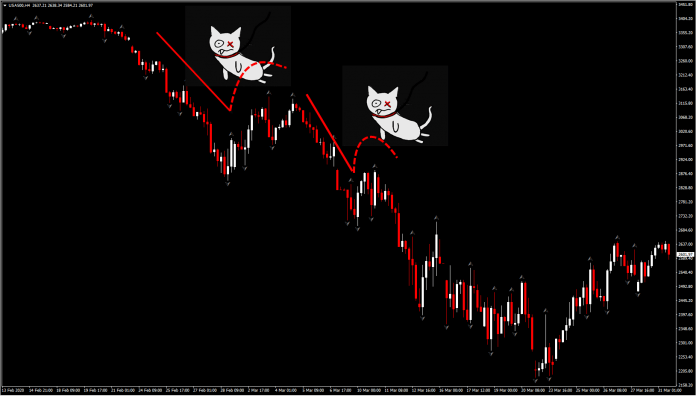
Generally, in the market, like in physics, there is the view that every action has a reaction, hence every sharp move will have a correction. That means market participants are confident that an uptrend could turn back after decline. However, the mentality of a dead cat bounce pattern is the exact opposite. The mentality here is that every steep sharp decline could see a temporary recovery before extending further lower again. An example is the USA500 in March.
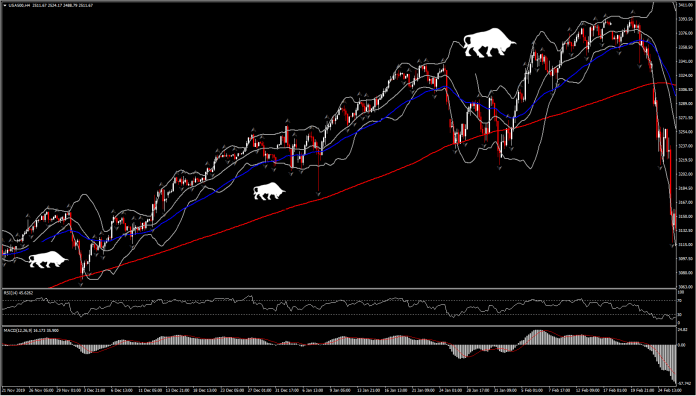
This 4-hour chart, between November 2019 up to February 2020, clearly presents the “buying the dip” mentality, since bulls have taken advantage of every pullback, e.g. December 2nd, January 6, January 30 and many more.
However, in a period of long sustained decline, the market changes its perceptions. In a period of an extended bear market, any swing lower is the harbinger for further collapse, while any swing higher are usually fading, on market participants’ perception that they will not last for long. The only tool that could help traders identify whether this might be a dead cat bounce or a trend reversal, is the Fibonacci retracement indicator.
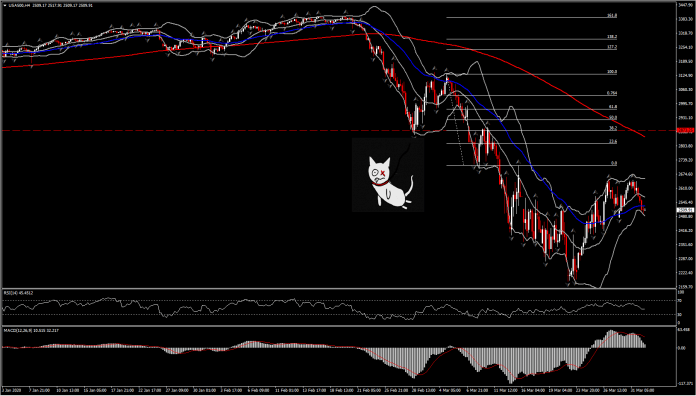
Theoretically, any rebound after a sharp long-lived decline, with less than 38.2% losses’ retracement, suggests that this is a shallow retracement and therefore is simply a dead cat bounce. This shallow rebound presents market assumption that there isn’t enough confidence in any rebound. There are always exceptions though, with a dead cat bounce confirmed on March 5, which reached 50% retracement before entering a free fall market again.
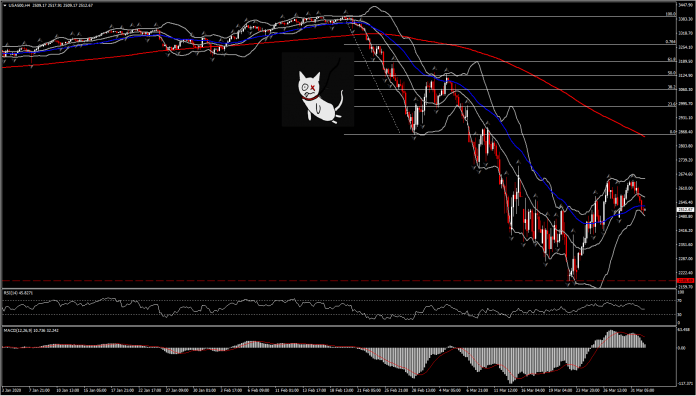
Hence when a dead cat bounce has been identified, it is crucial to monitor the market and to look for a breakout of the latest low level. Such a breakout would suggest the continuation of the downtrend. A confirmed close of the session below the latest low could also be the entry level for a short position with a tight stop loss, which could provide a high risk and reward profile. That said, stop loss should be placed at a sufficient level based on asset volatility and on the level of rebound. It is important to confirm the dead cat bounce before entering the market and to place stop losses above the peak of the dead cat bounce rather than at the peak, given that a higher high would be needed to negate the bearish view.
Author

Having completed her five-year-long studies in the UK, Andria Pichidi has been awarded a BSc in Mathematics and Physics from the University of Bath and a MSc degree in Mathematics, while she holds a postgraduate diploma (PGdip) in


