![]() Sam Seiden
Sam Seiden
Independent Analyst
Compare the average investor’s returns around the world to the average Wall Street firm’s returns. I think we would all agree that the average Wall Street firm is making the lion’s share of the money while the average investor is either losing or not making much at all. Why? Because, they know how to pick stocks!
Think about what the average investor around the world does in the markets, they “buy stock”. Now, think about what the average Wall Street firm does, they “sell stock”. Hhmm… One group is selling and making strong returns each year and the other, who is buying, hardly ever achieves their financial goals. Understand that I am not at all suggesting the average investor should stop buying stocks and start selling. What I am strongly suggesting is that the average investor needs to start “thinking the markets and investing” like Wall Street does.
Let’s think about how people around the world are conditioned to invest/trade. The education in grade school, high school, college, and graduate school is all the same. When taught how to pick stocks, here are the rules we all learned during our peak conditioning years:
-
Make sure it’s a good company
-
Make sure the company has a good balance sheet
-
Make sure the company has good management
-
Make sure the company has good earnings
-
Make sure the stock price is in an uptrend
When all these items are true, “buy the stock”. This is what everyone is conditioned to do at every level of education from a young age. Let me ask you, when all these items are true, where do you think the price of the stock is? It is hardly ever going to be cheap when this “must have” list is present. Most of the time, the stock price will be high.
Now let’s consider the basic lesson of how you make money buying and selling anything. The most profitable companies in history have mastered the art of buying at wholesale prices and selling what they bought at higher, retail prices. They simply repeat this process over and over and over. Think about the people you know who are smart shoppers when buying anything. They cut coupons, look for sale and negotiate for lower prices. This is also what our parents try to teach us during our developmental years.
The major issue here is that how we are conditioned to buy and sell in every other aspect of life is 100% opposite from what we are taught regarding how to pick stocks. When buying and selling anything in life outside of the trading and investing markets, we all try to buy at wholesale prices and sell at retail prices (homes, cars, whatever…). When buying and selling stocks for example, most people buy at retail prices and sell at wholesale prices. The average investor spends their life scratching their head because they can’t make this concept work, while the Wall Street mind laughs all the way to the bank. What happens each day in the markets is a massive transfer of accounts from the people who don’t have this basic understanding into the accounts of those who do.
To understand exactly how this transfer of accounts happens, you first need to understand exactly how market forces work. Would you like to know where price in any market is going to stop falling and turn higher or stop rallying and turn lower? In other words, would you like to know where the market is going to turn, before it turns? Here is how it all works… The movement of price in any and all free markets is a function of pure supply and demand. Low risk, high reward and high probability buying and selling opportunity is present at price levels where this simple and straight forward equation is out of balance. Meaning, price always turns at price levels where supply and demand is out of balance. Learning to identify a supply and demand imbalance on a price chart is the key to knowing where price is going to turn next and, therefore, knowing where and when the next trend is going to begin. Let’s review a price chart to get a basic understanding of how we quantify supply and demand as this will lead us to our objective opportunities for low risk gains.
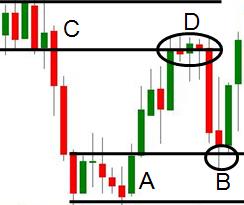
Notice price level “A”. For a period of time price was stable, suggesting supply and demand is in balance (equilibrium) at that level. Once price moves higher from “A”, it is clear that there was no equilibrium at “A”. In fact, we can now say that price level “A” represents a major supply and demand imbalance. We know this to be true because the only reason price moves higher from “A” is because there was much more willing demand than supply at “A”, it simply took time for this unbalanced equation to play out. You don’t need a technical indicator or some professional to tell you this; it’s simple logic. “B” represents the first decline in price to the objective demand level which is where we find our lowest risk/highest reward buying opportunity as we expect price to turn higher from this point.
“C” is just the opposite. It is a price level where objectively, supply exceeds demand. For a period of time price was stable at level “C”, and then there was a sharp decline. The decline tells us that there is much more supply than demand at “C”. “D” represents the first time price revisits the objective supply level which is where we want to sell or sell short as we expect price to turn lower at this point.
Wall Street (the consistently profitable trader/investor) knows how to pick stocks. They simply buys at demand (wholesale) levels and sells at supply (retail) levels. For reasons mentioned at the beginning of this piece, the average trader and investor buys at supply levels and sells at demand levels. This is why Wall Street or the Wall Street mind has such an easy time gaining profits and the average investor doesn’t. Now you can understand exactly where those profits come from. The reason the average investor never considers what I am suggesting in this piece is because they are blinded by the strong illusion that how we buy and sell in the trading and investing markets is somehow different from how we properly buy and sell anything else. This illusion and misconception is singlehandedly responsible for the massive transfer of accounts from those who are blinded by it, into the accounts of those who understand it. Simply put, how you buy and sell things in every other part of your life, grocery shopping, cars, homes and so on is EXACTLY how you should be buying and selling stocks and any other markets you may trade or invest in. There is NO difference in the proper action. Buy low, sell high and begin to smile at your finances just like Wall Street does.
Hope this was helpful, have a great day.
Note: All information on this page is subject to change. The use of this website constitutes acceptance of our user agreement. Please read our privacy policy and legal disclaimer. Opinions expressed at FXstreet.com are those of the individual authors and do not necessarily represent the opinion of FXstreet.com or its management. Risk Disclosure: Trading foreign exchange on margin carries a high level of risk, and may not be suitable for all investors. The high degree of leverage can work against you as well as for you. Before deciding to invest in foreign exchange you should carefully consider your investment objectives, level of experience, and risk appetite. The possibility exists that you could sustain a loss of some or all of your initial investment and therefore you should not invest money that you cannot afford to lose. You should be aware of all the risks associated with foreign exchange trading, and seek advice from an independent financial advisor if you have any doubts.
Editors’ Picks

EUR/USD holds steady above 1.1850 as markets eye Eurozone GDP, US CPI inflation releases
The EUR/USD pair trades on a flat note near 1.1870 during the early Asian session on Friday. The major pair steadies amid mixed signals from the latest release of US economic indicators. Traders await the preliminary reading of the Eurozone Gross Domestic Product for the fourth quarter and US inflation data, which are published later on Friday.

GBP/USD consolidates around 1.3600 vs. USD; looks to US CPI for fresh impetus
The GBP/USD pair remains on the defensive through the Asian session on Friday, though it lacks bearish conviction and holds above the 1.3600 mark as traders await the release of the US consumer inflation figures before placing directional bets.

USD/JPY rebounds above 153.00 ahead of US inflation data
USD/JPY stages a comeback and regains 153.00 in the Asian session, snapping a four-day losing streak amid some repositioning ahead of the US CPI report. However, expectations that Japan's PM Sanae Takaichi could be more fiscally responsible, along with bets that the BoJ will stick to its policy normalization path and the risk-off mood, could support the safe-haven Japanese Yen, capping the pair's upside.
Editors’ Picks
USD/JPY rebounds above 153.00 ahead of US inflation data
USD/JPY stages a comeback and regains 153.00 in the Asian session, snapping a four-day losing streak amid some repositioning ahead of the US CPI report. However, expectations that Japan's PM Sanae Takaichi could be more fiscally responsible, along with bets that the BoJ will stick to its policy normalization path and the risk-off mood, could support the safe-haven Japanese Yen, capping the pair's upside.

Gold: Will US CPI data trigger a range breakout?
Gold retakes $5,000 early Friday amid a turnaround from weekly lows as US CPI data loom. The US Dollar consolidates weekly losses as AI concerns-driven risk-off mood stalls downside. Technically, Gold appears primed for a big range breakout, with risks skewed toward a bullish break.

AUD/USD consolidates below 0.7100 as traders await US CPI report
AUD/USD consolidates the previous day's retracement slide from the vicinity of mid-0.7100s, or a three-year high, holding below 0.7100 as traders move to the sidelines ahead of Friday's release of the US consumer inflation figures. In the meantime, the divergent RBA-Fed outlooks might continue to support spot prices amid subdued US Dollar demand, though the risk-off impulse could act as a headwind for the Aussie.

Bitcoin, Ethereum and Ripple stay weak as bearish momentum persists
Bitcoin, Ethereum and Ripple remain under pressure, extending losses of over 5%, 6% and 4%, respectively, so far this week. BTC trades below $67,000 while ETH and XRP correct after facing rejection around key levels. With bearish momentum persisting and prices staying weak, the top three cryptocurrencies continue to show no clear signs of a sustained recovery.

A tale of two labour markets: Headline strength masks underlying weakness
Undoubtedly, yesterday’s delayed US January jobs report delivered a strong headline – one that surpassed most estimates. However, optimism quickly faded amid sobering benchmark revisions.
RECOMMENDED LESSONS
Making money in forex is easy if you know how the bankers trade!
I’m often mystified in my educational forex articles why so many traders struggle to make consistent money out of forex trading. The answer has more to do with what they don’t know than what they do know. After working in investment banks for 20 years many of which were as a Chief trader its second knowledge how to extract cash out of the market.
5 Forex News Events You Need To Know
In the fast moving world of currency markets where huge moves can seemingly come from nowhere, it is extremely important for new traders to learn about the various economic indicators and forex news events and releases that shape the markets. Indeed, quickly getting a handle on which data to look out for, what it means, and how to trade it can see new traders quickly become far more profitable and sets up the road to long term success.
Top 10 Chart Patterns Every Trader Should Know
Chart patterns are one of the most effective trading tools for a trader. They are pure price-action, and form on the basis of underlying buying and selling pressure. Chart patterns have a proven track-record, and traders use them to identify continuation or reversal signals, to open positions and identify price targets.
7 Ways to Avoid Forex Scams
The forex industry is recently seeing more and more scams. Here are 7 ways to avoid losing your money in such scams: Forex scams are becoming frequent. Michael Greenberg reports on luxurious expenses, including a submarine bought from the money taken from forex traders. Here’s another report of a forex fraud. So, how can we avoid falling in such forex scams?
What Are the 10 Fatal Mistakes Traders Make
Trading is exciting. Trading is hard. Trading is extremely hard. Some say that it takes more than 10,000 hours to master. Others believe that trading is the way to quick riches. They might be both wrong. What is important to know that no matter how experienced you are, mistakes will be part of the trading process.
The challenge: Timing the market and trader psychology
Successful trading often comes down to timing – entering and exiting trades at the right moments. Yet timing the market is notoriously difficult, largely because human psychology can derail even the best plans. Two powerful emotions in particular – fear and greed – tend to drive trading decisions off course.