![]() Elliott Wave Forecast Team
Elliott Wave Forecast Team
ElliottWave-Forecast.com
In the first place the point of measuring a Fibonacci extension is to get the area pinpointed that an Elliott Wave correction will move against the trend. The conventional thought is that the market will trend in impulses of 5, 9, & 13 swings. The corrections against the trend will move in 3, 7 or 11 swings. The exception to that is a stand alone triangle which is five sideways three swing cycles. Generally speaking I think you will see how these measurements are very simple and easy to do.
Uniquely, one thing price action in flats can do is trick the market into thinking a previous trend up or down has ended a cycle. Afterward, of the flat correction the prevailing trend resumes. In this article the focus will be on the three different types of Elliott Wave flat corrections. All of these descriptions and graphics are shown as corrections to a bullish trend. They can be applied to a bearish trend as well using them inversely.
Firstly you will need a Fibonacci extension tool on your chart platform. Go to the settings where you can adjust the measurement levels. Set it to show you the 61.8%, 100.%, 123.6% & the 161.8%. On into the first flat structure we will look at a regular flat structure that subdivides 3-3-5. Overall it is a 3 waves move labeled as ABC. The subdivision of wave A and B is in 3 waves and the subdivision of wave C is in 5 waves as an impulse or diagonal. The subdivision of wave A and B can be in any corrective 3 waves structure including zigzag, flat, double three or triple three. Wave B terminates near the start of wave A usually at about the 90% retracement.
Wave C generally terminates slightly beyond the end of wave A with momentum divergence. Measure the extension like this. On this chart, point 1 will be at the beginning upper left side. Presume a bullish cycle ended there. Go from there down to the wave A low as point 2. From there the point 3 will be at the top of the wave B. This will give the projected Fibonacci extension area for the wave C which can be only 61.8% however 100% or 123.6% of wave A & B is more common on up to 161.8%. Continued below the regular flat picture.

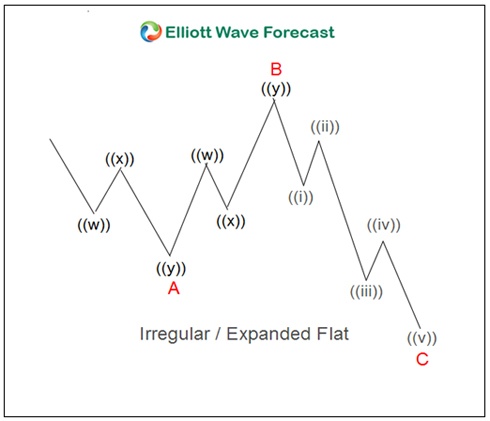
Secondly we will look at an expanded flat. This is a corrective 3 wave move labeled ABC in like manner as well as subdivides as 3-3-5. The subdivision of wave A and B can be in any corrective 3 waves structure including zigzag, flat, double three or triple three. As can be seen, Wave B terminates beyond the beginning of wave A usually about a 123.6% retracement of wave A. In addition Wave C generally terminates way beyond the end of wave A. It should show momentum divergence. The subdivision of wave C is in 5 waves as an impulse or diagonal.
Ordinarily the wave C will be 123.6% to 161.8% of wave A. This is measured in the same fashion as the aforementioned regular flat. Point 1 will be at the beginning upper left side. Presume a bullish cycle ended there. Go from there down to the wave A low as point 2. From there the point 3 will be at the top of the wave B. This will give the projected Fibonacci extension area for the wave C. Continued below the expanded flat graphic.
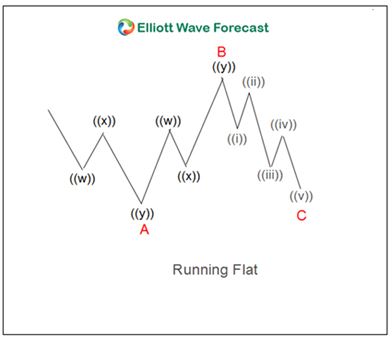
Lastly a running flat is a corrective 3 wave move labeled ABC that subdivides 3-3-5. The subdivision of wave A and B can be in any corrective 3 waves structure including zigzag, flat, double three or triple three. The subdivision of wave C is in 5 waves as an impulse or diagonal and terminates with momentum divergence.
Conclusion: In the final analysis, this type of flat wave B of the 3-3-5 pattern terminates substantially beyond the starting level of wave A as in an expanded flat usually around 123.6% retracement. In addition Wave C travels anywhere from 61.8% to 100% of the wave A. As a matter of fact. it will fall short of the level where wave A ended. Measurements are taken in the same fashion as previously mentioned. Point 1 will be at the beginning upper left side. Similarly presume a bullish cycle ended there. Go from there down to the wave A low as point 2. From there the point 3 will be at the top of the wave B. This will give the projected Fibonacci extension area for the wave C.
Interested in active FX or CRYPTO Elliott Wave labeled charts on a daily basis? Now it's your time; we have a SPECIAL offer; 50% Off on FX and Crypto markets. Check Elliott Wave Forecast website for more details.
FURTHER DISCLOSURES AND DISCLAIMER CONCERNING RISK, RESPONSIBILITY AND LIABILITY Trading in the Foreign Exchange market is a challenging opportunity where above average returns are available for educated and experienced investors who are willing to take above average risk. However, before deciding to participate in Foreign Exchange (FX) trading, you should carefully consider your investment objectives, level of xperience and risk appetite. Do not invest or trade capital you cannot afford to lose. EME PROCESSING AND CONSULTING, LLC, THEIR REPRESENTATIVES, AND ANYONE WORKING FOR OR WITHIN WWW.ELLIOTTWAVE- FORECAST.COM is not responsible for any loss from any form of distributed advice, signal, analysis, or content. Again, we fully DISCLOSE to the Subscriber base that the Service as a whole, the individual Parties, Representatives, or owners shall not be liable to any and all Subscribers for any losses or damages as a result of any action taken by the Subscriber from any trade idea or signal posted on the website(s) distributed through any form of social-media, email, the website, and/or any other electronic, written, verbal, or future form of communication . All analysis, trading signals, trading recommendations, all charts, communicated interpretations of the wave counts, and all content from any media form produced by www.Elliottwave-forecast.com and/or the Representatives are solely the opinions and best efforts of the respective author(s). In general Forex instruments are highly leveraged, and traders can lose some or all of their initial margin funds. All content provided by www.Elliottwave-forecast.com is expressed in good faith and is intended to help Subscribers succeed in the marketplace, but it is never guaranteed. There is no “holy grail” to trading or forecasting the market and we are wrong sometimes like everyone else. Please understand and accept the risk involved when making any trading and/or investment decision. UNDERSTAND that all the content we provide is protected through copyright of EME PROCESSING AND CONSULTING, LLC. It is illegal to disseminate in any form of communication any part or all of our proprietary information without specific authorization. UNDERSTAND that you also agree to not allow persons that are not PAID SUBSCRIBERS to view any of the content not released publicly. IF YOU ARE FOUND TO BE IN VIOLATION OF THESE RESTRICTIONS you or your firm (as the Subscriber) will be charged fully with no discount for one year subscription to our Premium Plus Plan at $1,799.88 for EACH person or firm who received any of our content illegally through the respected intermediary’s (Subscriber in violation of terms) channel(s) of communication.
Editors’ Picks

EUR/USD recedes to daily lows near 1.1850
EUR/USD keeps its bearish momentum well in place, slipping back to the area of 1.1850 to hit daily lows on Monday. The pair’s continuation of the leg lower comes amid decent gains in the US Dollar in a context of scarce volatility and thin trade conditions due to the inactivity in the US markets.

GBP/USD flat lines near 1.3650 ahead of UK and US data
GBP/USD kicks off a new week on a subdued note and oscillates in a narrow range near 1.3650 on Monday. The mixed fundamental backdrop warrants some caution for aggressive traders as the market focus now shifts to this week's important data releases from the UK and the US.

USD/JPY advances on weak Japanese GDP, holiday-thinned trading
USD/JPY rises while US and Japanese markets remain closed for holidays. Weak Japanese Gross Domestic Product figures curb tightening expectations. Investors await speeches from Federal Reserve Vice Chair for Supervision.
Editors’ Picks
EUR/USD recedes to daily lows near 1.1850
EUR/USD keeps its bearish momentum well in place, slipping back to the area of 1.1850 to hit daily lows on Monday. The pair’s continuation of the leg lower comes amid decent gains in the US Dollar in a context of scarce volatility and thin trade conditions due to the inactivity in the US markets.
GBP/USD flat lines near 1.3650 ahead of UK and US data
GBP/USD kicks off a new week on a subdued note and oscillates in a narrow range near 1.3650 on Monday. The mixed fundamental backdrop warrants some caution for aggressive traders as the market focus now shifts to this week's important data releases from the UK and the US.

Gold corrects lower, tries to stabilize above $5,000
Gold started the week under bearish pressure and declined to the $4,960 area before staging a modest rebound. As trading volumes remain thin with the US financial markets remaining closed on Presidents' Day holiday, XAU/USD looks to stabilize above $5,000 ahead of this week's key data releases.

Bitcoin consolidates as on-chain data show mixed signals
Bitcoin price has consolidated between $65,700 and $72,000 over the past nine days, with no clear directional bias. US-listed spot ETFs recorded a $359.91 million weekly outflow, marking the fourth consecutive week of withdrawals.

The week ahead: Key inflation readings and why the AI trade could be overdone
It is likely to be a quiet start to the week, with US markets closed on Monday for Presidents Day. European markets are higher across the board and gold is clinging to the $5,000 level after the tamer than expected CPI report in the US reduced haven flows to precious metals.
RECOMMENDED LESSONS
Making money in forex is easy if you know how the bankers trade!
I’m often mystified in my educational forex articles why so many traders struggle to make consistent money out of forex trading. The answer has more to do with what they don’t know than what they do know. After working in investment banks for 20 years many of which were as a Chief trader its second knowledge how to extract cash out of the market.
5 Forex News Events You Need To Know
In the fast moving world of currency markets where huge moves can seemingly come from nowhere, it is extremely important for new traders to learn about the various economic indicators and forex news events and releases that shape the markets. Indeed, quickly getting a handle on which data to look out for, what it means, and how to trade it can see new traders quickly become far more profitable and sets up the road to long term success.
Top 10 Chart Patterns Every Trader Should Know
Chart patterns are one of the most effective trading tools for a trader. They are pure price-action, and form on the basis of underlying buying and selling pressure. Chart patterns have a proven track-record, and traders use them to identify continuation or reversal signals, to open positions and identify price targets.
7 Ways to Avoid Forex Scams
The forex industry is recently seeing more and more scams. Here are 7 ways to avoid losing your money in such scams: Forex scams are becoming frequent. Michael Greenberg reports on luxurious expenses, including a submarine bought from the money taken from forex traders. Here’s another report of a forex fraud. So, how can we avoid falling in such forex scams?
What Are the 10 Fatal Mistakes Traders Make
Trading is exciting. Trading is hard. Trading is extremely hard. Some say that it takes more than 10,000 hours to master. Others believe that trading is the way to quick riches. They might be both wrong. What is important to know that no matter how experienced you are, mistakes will be part of the trading process.
The challenge: Timing the market and trader psychology
Successful trading often comes down to timing – entering and exiting trades at the right moments. Yet timing the market is notoriously difficult, largely because human psychology can derail even the best plans. Two powerful emotions in particular – fear and greed – tend to drive trading decisions off course.