How to define a trend, enter trades, leverage and the best times to trade

How to define a trend, enter trades, leverage and the best times to trade… The idea of trading due to a sudden change of mind and notion might seem intriguing but in reality it is increasingly onerous as compared to someone who has conventional way to perceive markets in a systematic way. The key rule for trading and investing is to deal with information in a calculated and tactical way.
While building a strategy the trader needs to have a look at basic areas of trade; there are indeed various ways of doing so. This article will give an account on them.
The First Step
to succesful trading
The first step is decision making, a trader needs to plan which sort of market condition they are searching to take advantage of. The market displays three general conditions:
- Trend (Uptrend or Downtrend)
- Range
- Breakout
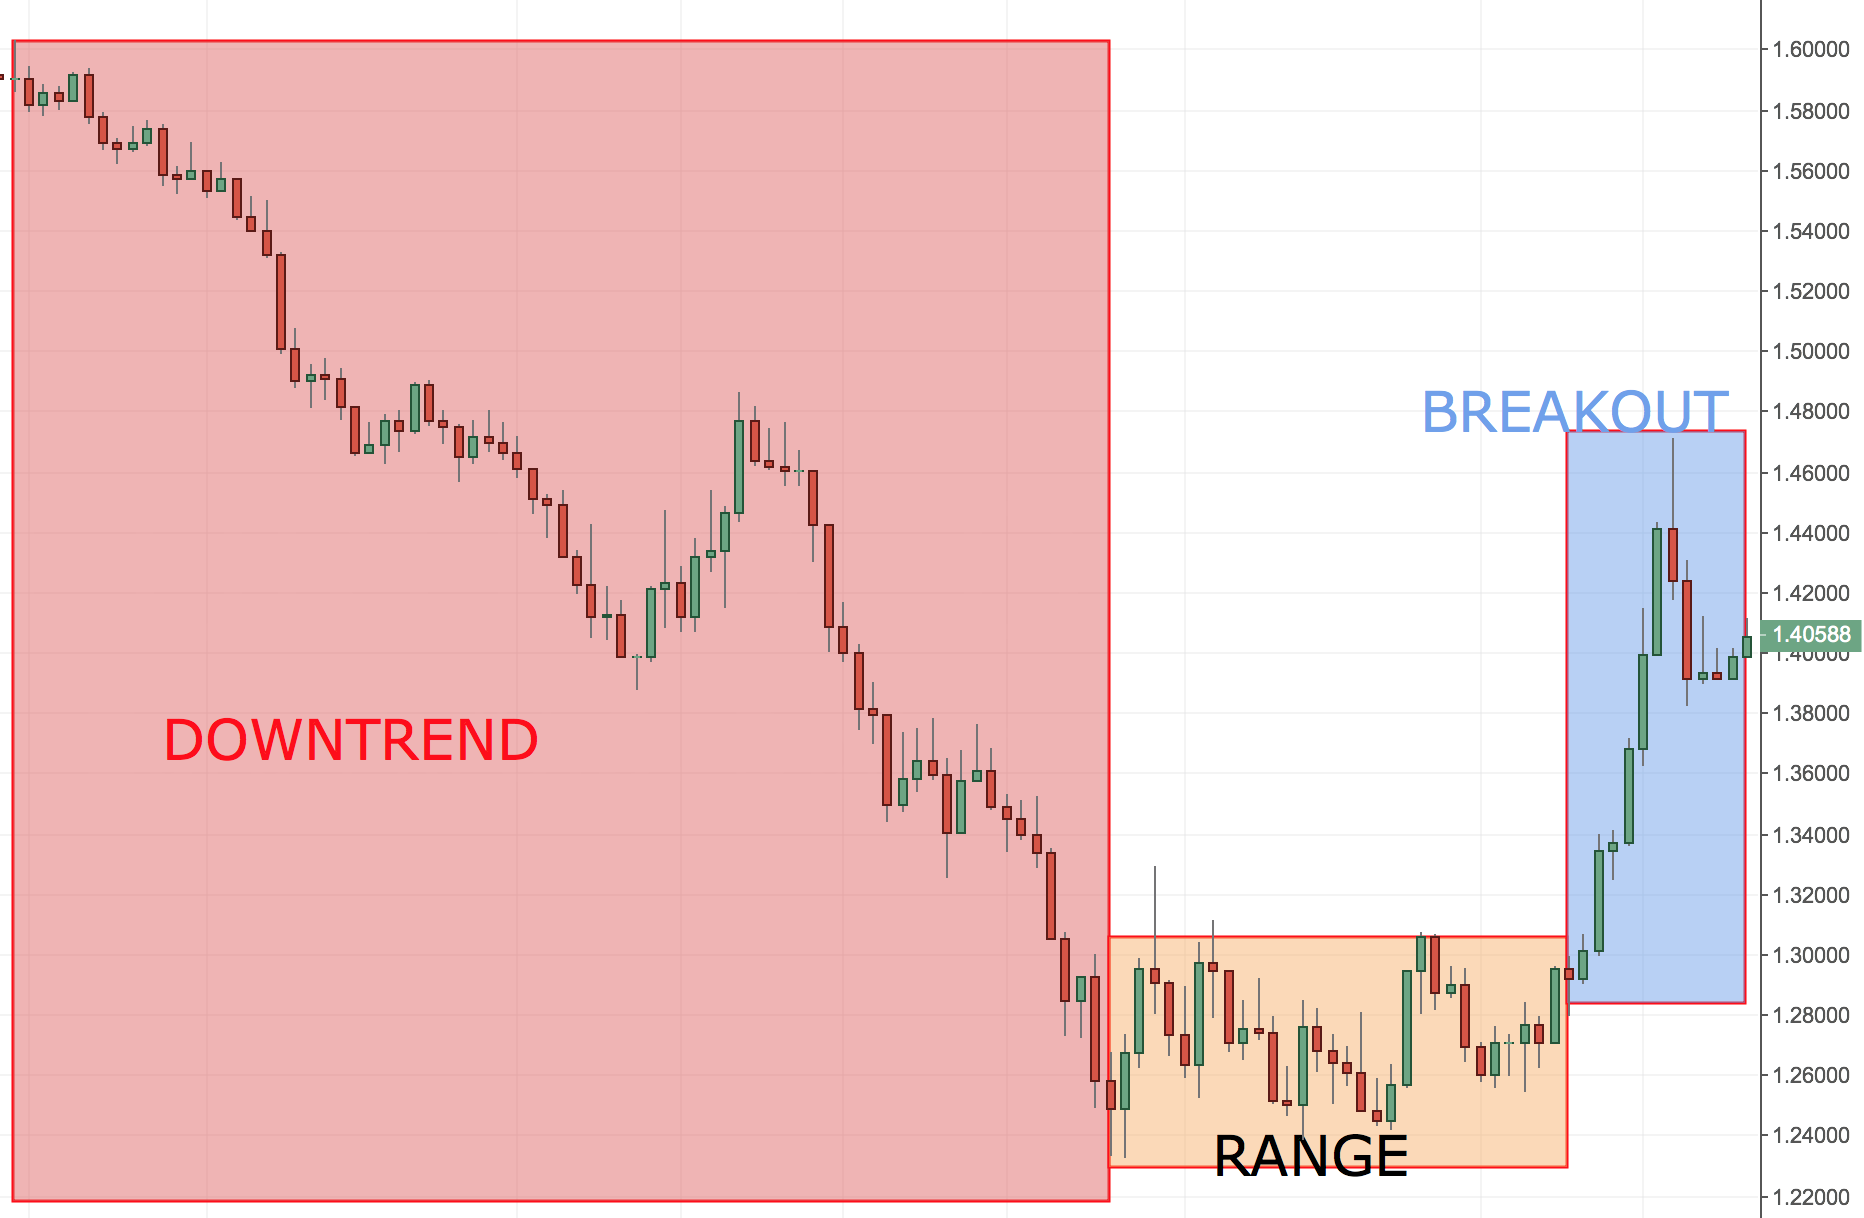
The above mentioned market conditions exhibit noticeable different hues, for instance, ranges. Ranges normally occur during quiet markets but as soon as the price breaks out usually in the shape of stimuli or in the form of news thesupport and/or resistance that denote the ranges are broken.
Breakouts are rapid and unrestrained, jumping swiftly to a traders stop or limit. They are fraught (very volatile) and because of this in terms of money and risk management strategies must be build otherwise as compared to range or trend techniques.
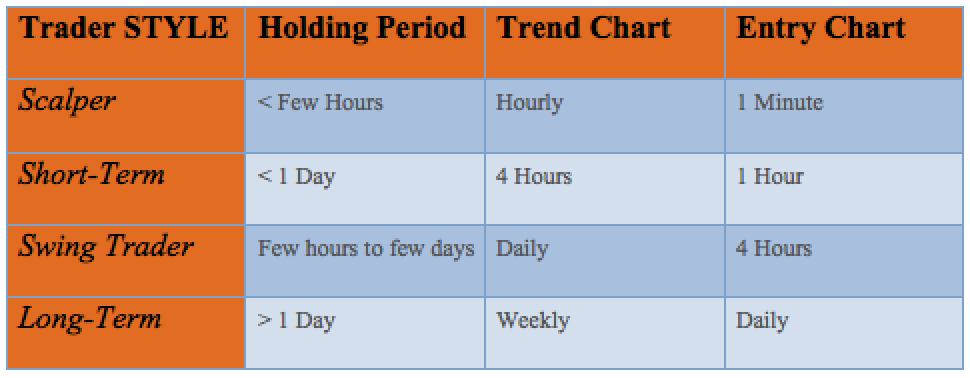
The next step after speculating which market condition a trader is building a strategy for is forming a decision on timeframes. The decision will help them in surveying and accomplishing their trade in a specific holding time.
A trader can use two kinds of charts in the case of time-frames:
- Long-term charts: to compute the general trends that may occur in a currency pair (or another security).
- Short-term chart: to get a more detailed view as they enter the trade
Entering The Trade
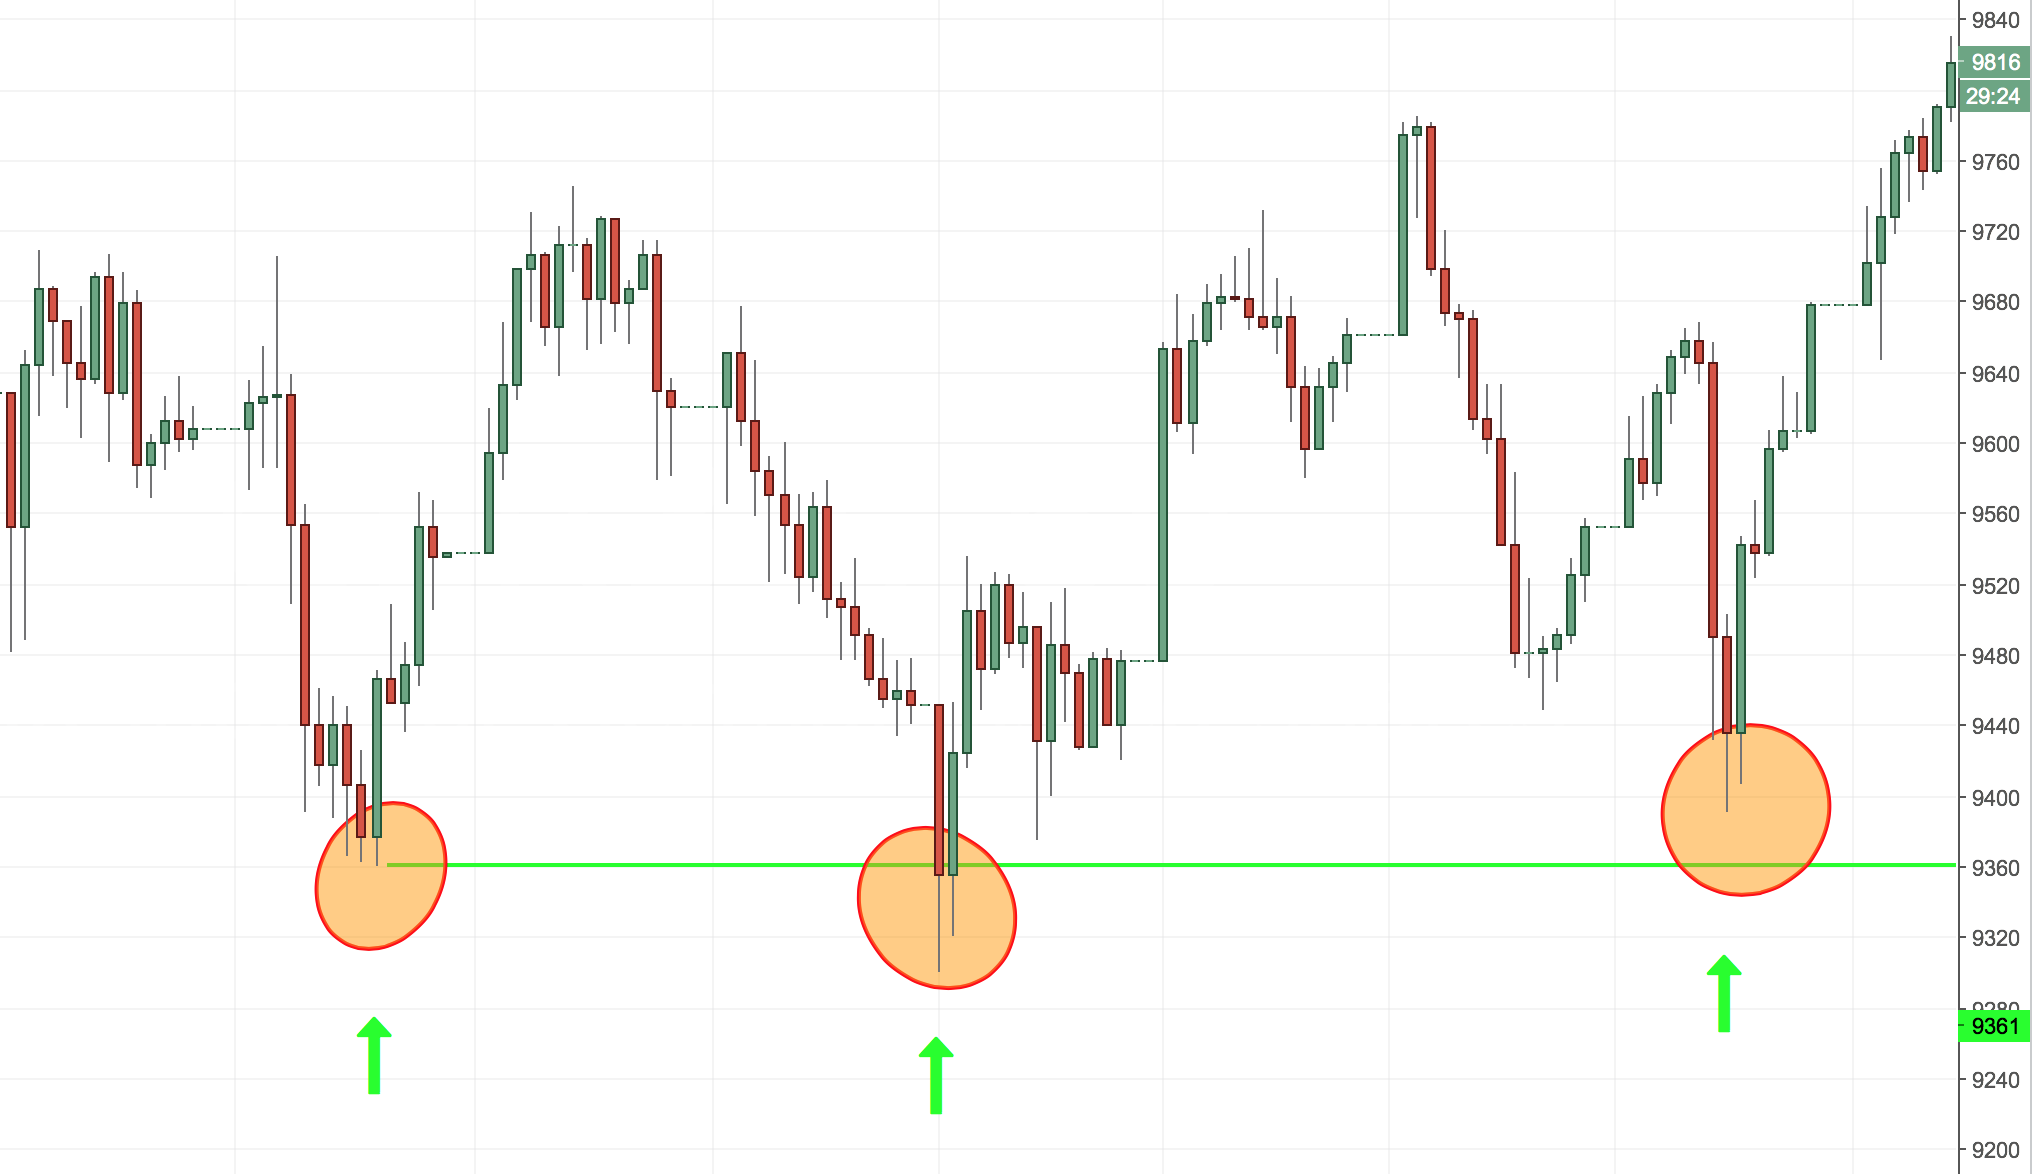
How to enter the trades? This is the next step in forming a strategy. As ranges are generally represented by support and resistance, by defining breakouts, traders can somewhat assist themselves with risk management in trend-based strategies.
This can often aid the trader by allowing various techniques for ensuring which of these levels are suitable and relevant.
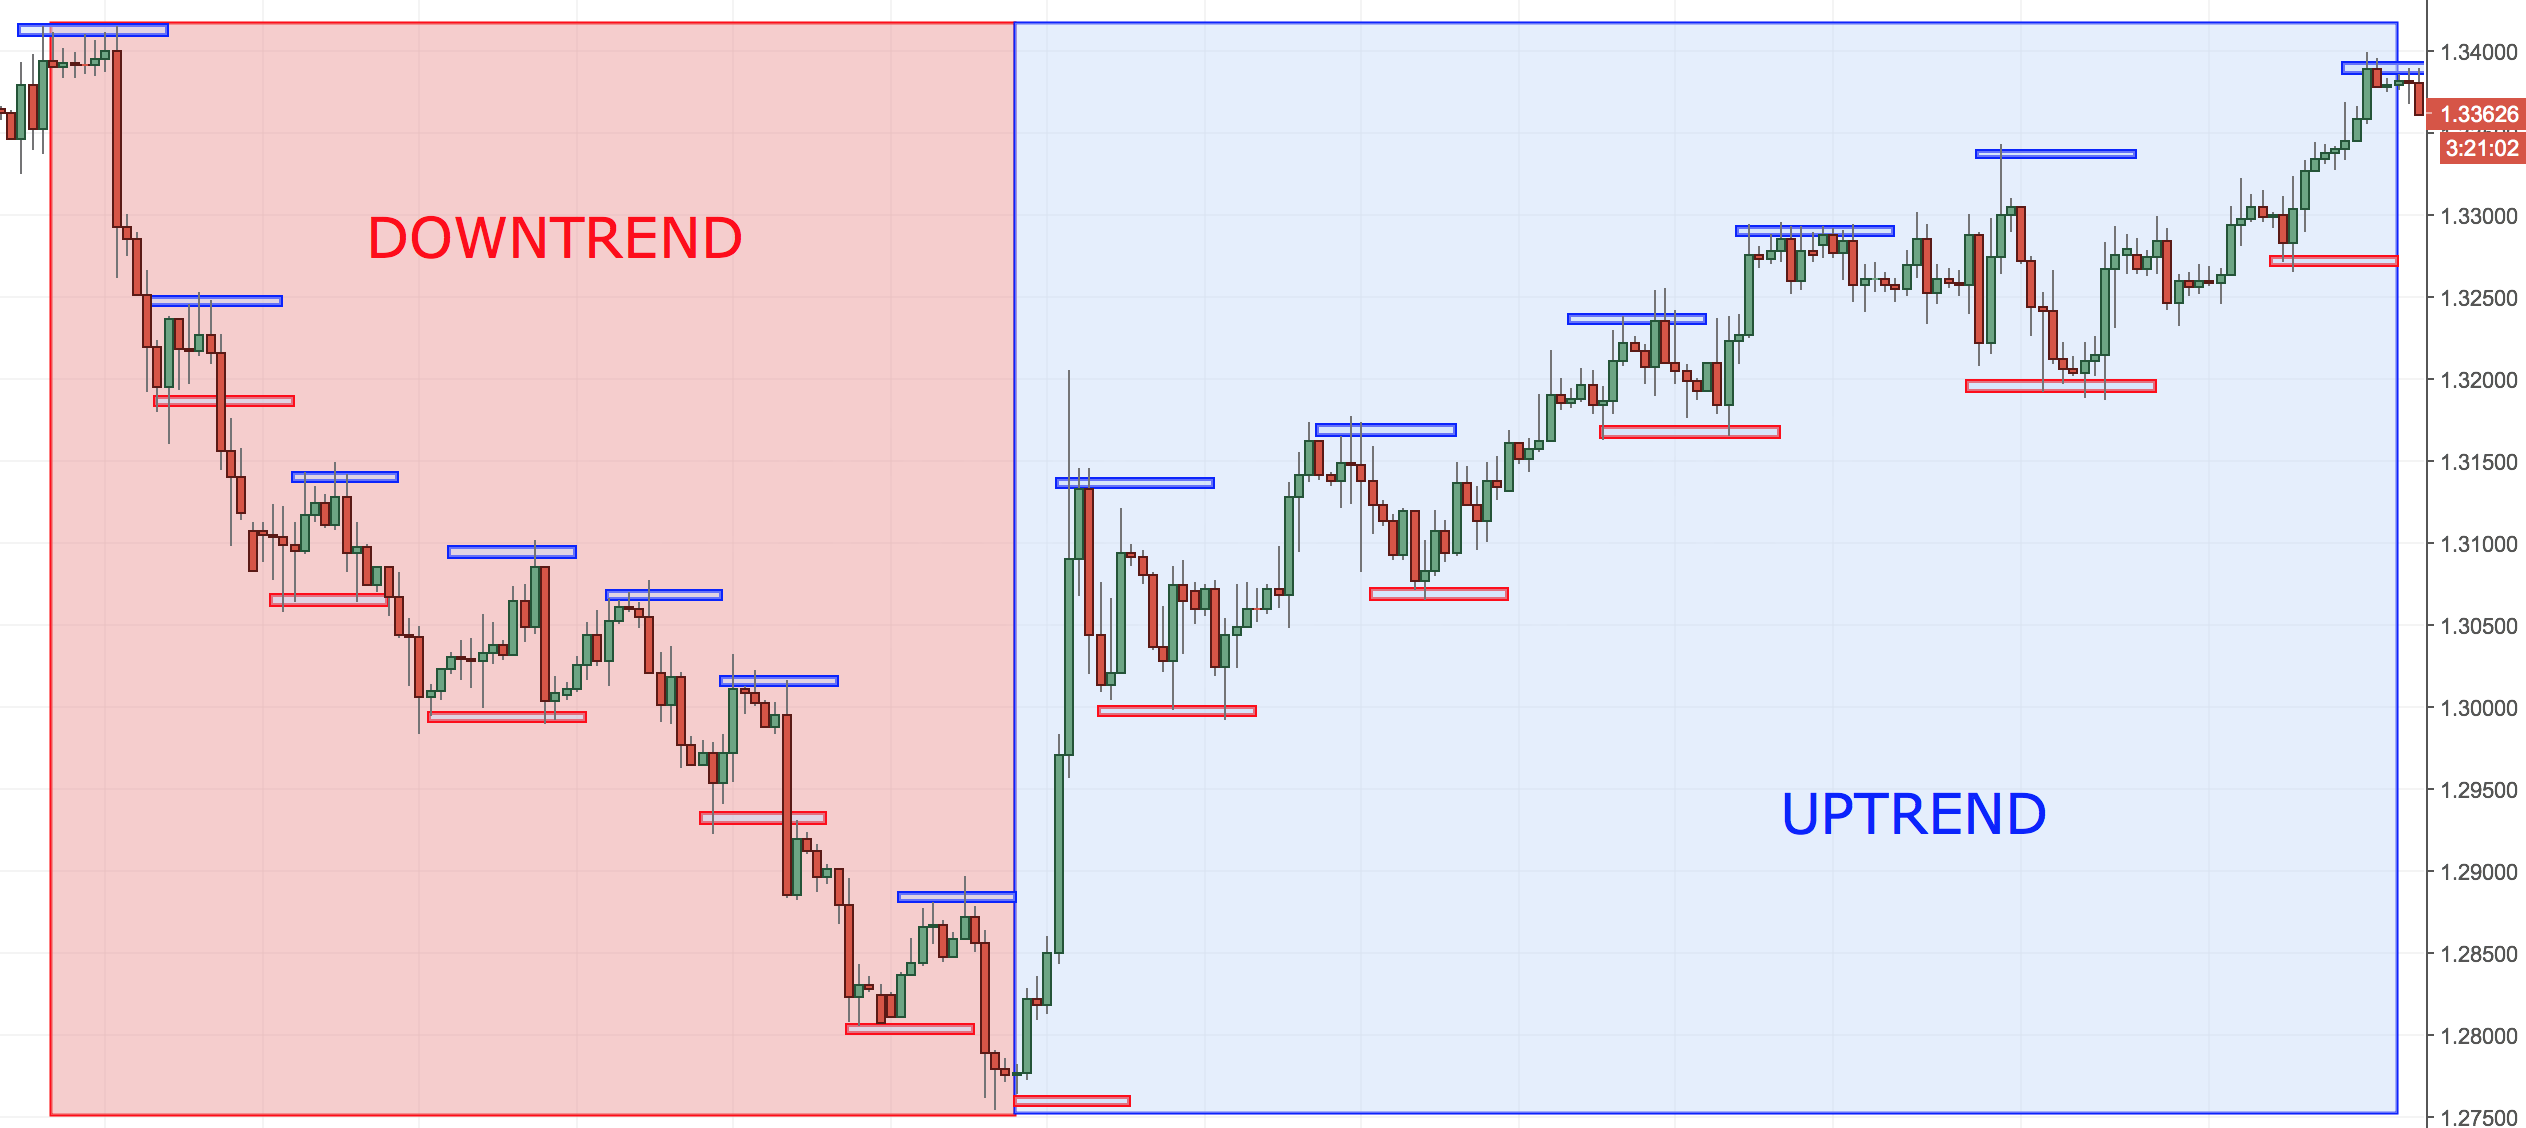
Moving forward, the next step is finding a way to rank the strength of price moves; this must be done after the trader has decided the peculiarity of support and resistance that is required in the strategy. Depending on how strong a trend has been, the following things should be taken into account:
- Concepts of Price Action
- Multiple Time Frame Analysis
- Market Conditions
Risk Management
For sustaining a trading approach, traders consider risk management as the most important part of their tranding plan. In other words, this is how a trader manages the risk.
An experiment was conducted in an effort to find what had worked the best and how traders could work on attaining those results. In the experiment the results from actual traders on over 12 million trades were inspected.
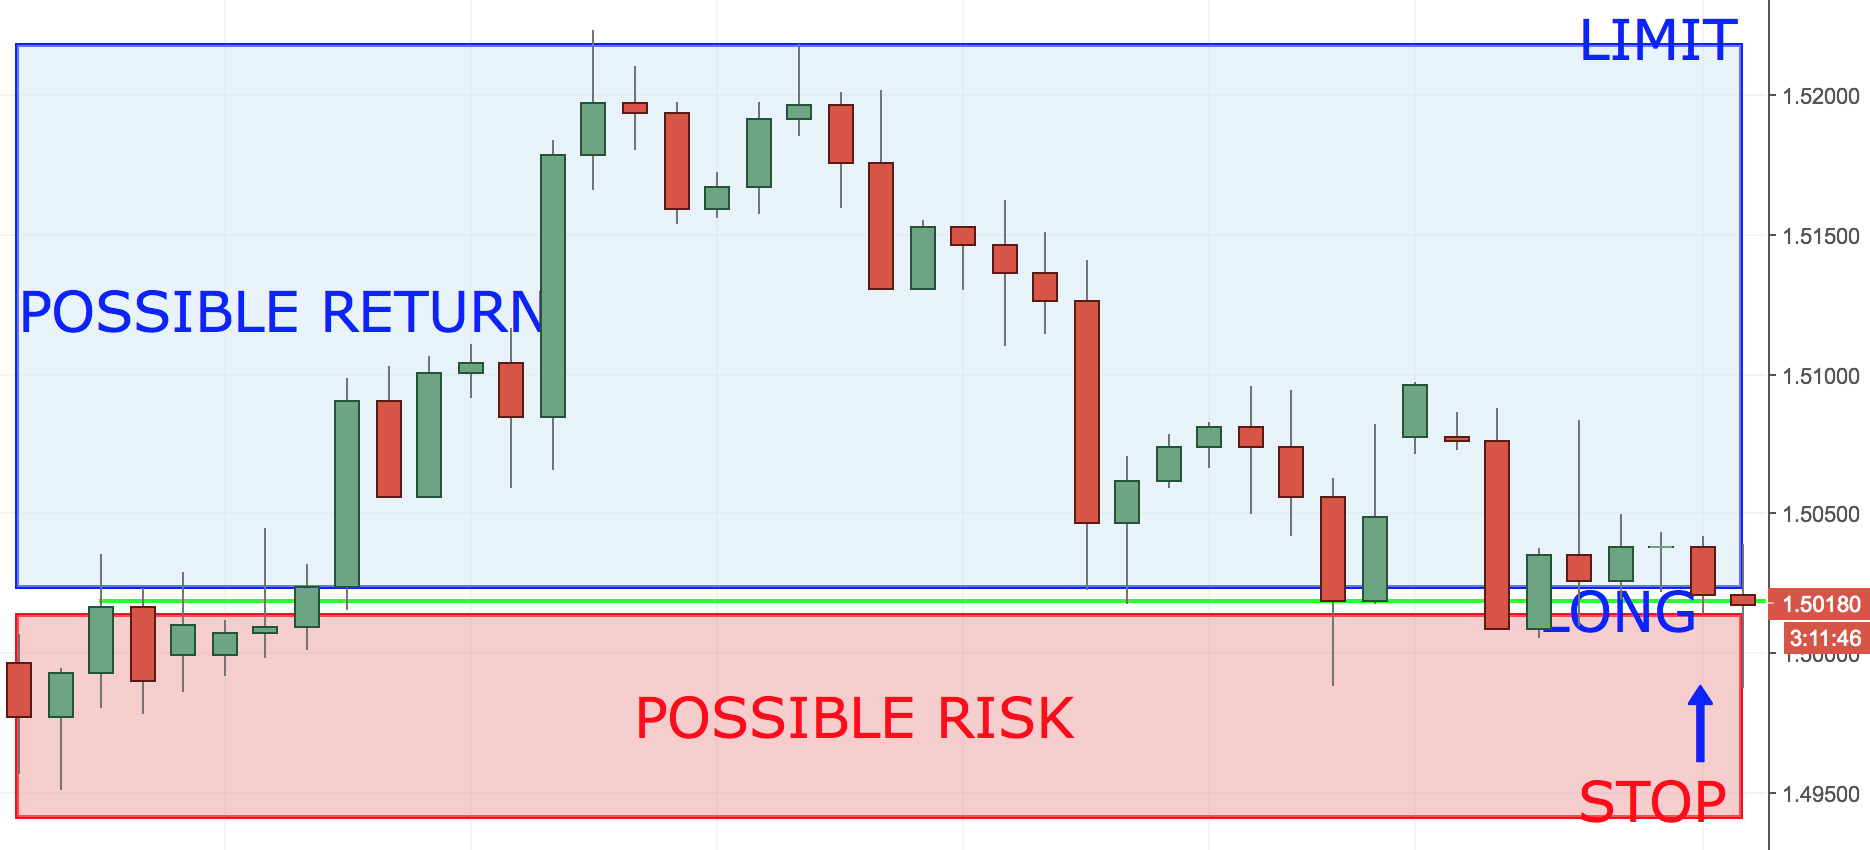
It was observed that the winning percentage was greater than 50% which concluded that even if many traders may win more often than they lose their success or failure in the markets was predicted by the amount of gains and losses. Furthermore, usage of risk-to-reward ratios were also taken into consideration, in which the trader is said to make more if they are correct than they could lose if they are wrong. Below the picture illustrates the reward ratio.
Leverage
-fourth and final installment of a successful trade,
generally provides very discerning information. Our investigation on this concept concluded:
At the bottom of the graph we can see lower level of leverage. The traders with larger balances between $5,000 and $9,999 used them resulting into greater profitability.
There is a huge divergence between traders using normal 5:1 leverage ratio and traders using 26:1 leverage ratio. Those who used the former one were in profit 78% more than those who used the later one. Traders using leverage of 5:1 gained profit 37.37% of the time, on the other hand traders with balances below $1000 made only 20.91% of the profit while using 26:1 leverage.
Conclusion: for making more profit, an effective leverage of 10-to-1 or less should be used by the traders
When to Execute Your Strategy
Many of the areas that traders would want to keep in mind while building their strategies have already been covered. Here comes the most important point, when to utilise the strategy that we have created?
Key factor of FX market that separates it from the rest is that it never closes.
Even though the market is open around the clock, based on time of the day and where the liquidity is being offered from,price action usually takes on markedly various hues.
Let’s take Asian (Tokyo) session as an example. It offers slower price action with stronger help to support and resistance and the potential for big moves are seemingly lower. Due to this fact, traders who want to apply range-based techniques are better served in Asian session if they focus on their entries.
The “heart” of FX market according to some traders is when the liquidity starts to flow in from London at 3AM ET (8 AM GMT). London being the hub of trading, allows few advantages. Firstly, it allows bringing in a high volume of activity in the market and secondly right after the opening enormous moves can be seen on the major currency pairs (and also other securities). The support and resistance can be broken easily here because of the onrush of liquidity coming from London – a cautious point for the traders who were formerly using range strategies in Asian session. A plus point for the traders who are using the breakout strategy is that they can profit by the swift and volatile markets they are searching for after the London open.
More activity can be witnessed into the FX market as the US opens for business at 8AM. The most extensive period of the day in FX market is the overlap period. It is the time when both London and New York market centers are in business. Ample quick moves, high volatility, as the capacity for turnaround can decry even the toughest range strategies.
US session changes a little after London closes for the day. Normal hourly moves are decreased, the price moves are diminished. Slow price moves underlined by a greater degree of respect for formerly described support and resistance levels are an imitation to Asian session. In the chart below, the different trading sessions have been marked for your ease.

Author

Colibri Trader
Colibri Trader
Colibri Trader, as he is known in the circles, is based in London, UK. He Started his career in one of the leading prop trading houses at the time and then has moved out to form his own company- Colibri Trader Limited.


