Share:

A currency movement fake-out, or a fake price breakout above or below a support or resistance level, is the bane of professional and amateur traders alike. They are just so hard to spot and difficult to remedy. The scenario usually goessomething like this: you’ve done your homework, you believe that the price is highly overvalued and think it should drop substantially, you’ve patiently waited for the price to fall below a long-held level for about 2 months, it finally does triggering your stop order… but then as if tripped up by a head fake on a basketball court, the price almost immediately pops right back up again taking your position way into the red.

Well, prevention is better than cure so the best strategy to avoid these situations is to wait until the price falls convincingly above or below a level. Never place an at-market order. Place a stop ‘buy’ or a stop ‘sell’ order to prevent yourself making impulsive trades, it’s important to remain disciplined.

The second strategy is (if for example, talking about a shorting order) to wait until the price settles at a level below the support and then put in a sell stop order below that. Often, the price or market will ‘think’ about the new price reality once a support or resistance level is broken and then continue its way down (or bounce back up if there is no further selling pressure). Place a sell-stop order a good 10 or 20 pips away from a support level, just in case it’s been miscalculated and placed incorrectly on the chart and even then, only allocate a small percentage of your equity to the position.Always assume there’s very good chance you’ve got it wrong.

Another important way to assess whether the break of a support or resistance level is genuine is to monitor appropriate technical indicators. For example, if there is divergence in an oscillator technical indicator signalling that there is upwards buying pressure, but the impervious pricefalls below a resistance line, it’s best to have your ducks lined up in row and hold fire. This approach is the same for fundamental analysis. If there is no real motivation for a price to fall below significant support (i.e. data release or geopolitical event), but it has been broken nonetheless, then again, it’s best to hold fire. If you have decided to enter a position, as mentioned, it’s best to wait until the price persuasively falls below a level. This means waiting until the next period (on the daily chart) or even the period after the next to confirm that the price is indeed following a new path.

If an order has already been triggered following a price spike down or up, stop losses are vital for cutting losses if the price rebounds in the opposite direction. If no stop loss has been added to the position, then a manual closing of the position is absolutely necessary. It will be difficult to accept the loss and to recognise the mistake, but a stop loss situated at the broken support or resistance level is the best policy. It’s best to recognise this fake-out problem as soon as possible as quickly retracing price behaviour can quickly become painful. Remember, every losing trade has a silver lining if you can learn from the error of judgement.

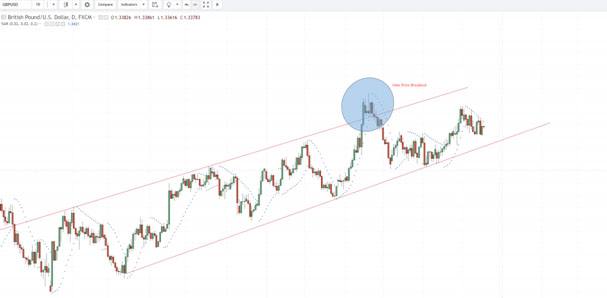
The below chart is an example of a GBP/USD misleading price breakout that lacks momentum to push higher. Notice the price falls in the period after the breakout.

GBPUSD

All essays, research and information found above represent the analysis and opinion of Leverate only. As such it may prove wrong and be a subject to change without notice. Opinions and analysis were based on data available to the author of the respective essays at the time of writing. Although the information provided above is based on careful research and sources that are believed to be accurate, Leverate does not guarantee the accuracy or thoroughness of the data or information reported. The opinions published above are neither an offer nor a recommendation to purchase or sell any securities. Leverate is not a Registered Securities Advisor. By reading Leverate’s reports you fully agree that they will not be held responsible or liable for any decisions you make regarding any information provided in these reports. Investment trading and speculation in any financial markets may involve risk of loss.e risk of loss.

Editors’ Picks

EUR/USD hovers around 1.0700, eyes on US first-quarter GDP data

EUR/USD hovers around 1.0700, eyes on US first-quarter GDP data

EUR/USD hovers around the 1.0700 psychological level on Thursday during the early Asian session. The modest uptick of the major pair is supported by the softer US Dollar. Later in the day, Germany’s GfK Consumer Confidence Survey for April will be released. 

EUR/USD News

GBP/USD snaps the two-day winning streak above 1.2450, eyes on US GDP data

GBP/USD snaps the two-day winning streak above 1.2450, eyes on US GDP data

The GBP/USD pair snaps the two-day winning streak near 1.2460 amid the modest rebound of the US Dollar on Thursday during the early Asian session. The release of the US Gross Domestic Product for the first quarter will take center stage on the day. 

GBP/USD News

USD/JPY finds its highest bids since 1990, near 155.50

USD/JPY finds its highest bids since 1990, near 155.50

USD/JPY keeps breaking into its highest chart territory since June of 1990 early Thursday, testing 155.50 for the first time in 34 years as the Japanese Yen remains vulnerable, despite looming Japanese intervention risks. Focus shifts to Thursday's US GDP report and the BoJ decision on Friday. 

USD/JPY News

Editors’ Picks

AUD/USD hovers around 0.6500 amid light trading, ahead of US GDP

AUD/USD hovers around 0.6500 amid light trading, ahead of US GDP

AUD/USD is trading close to 0.6500 in Asian trading on Thursday, lacking a clear directional impetus amid an Anzac Day holiday in Australia. Meanwhile, traders stay cautious due ti risk-aversion and ahead of the key US Q1 GDP release. 

AUD/USD News

USD/JPY finds its highest bids since 1990, near 155.50

USD/JPY finds its highest bids since 1990, near 155.50

USD/JPY keeps breaking into its highest chart territory since June of 1990 early Thursday, testing 155.50 for the first time in 34 years as the Japanese Yen remains vulnerable, despite looming Japanese intervention risks. Focus shifts to Thursday's US GDP report and the BoJ decision on Friday. 

USD/JPY News

Gold price lacks firm intraday direction, holds steady above $2,300 ahead of US data

Gold price lacks firm intraday direction, holds steady above $2,300 ahead of US data

Gold price remains confined in a narrow band for the second straight day on Thursday. Reduced Fed rate cut bets and a positive risk tone cap the upside for the commodity. Traders now await key US macro data before positioning for the near-term trajectory.

Gold News

Injective price weakness persists despite over 5.9 million INJ tokens burned

Injective price weakness persists despite over 5.9 million INJ tokens burned

Injective price is trading with a bearish bias, stuck in the lower section of the market range. The bearish outlook abounds despite the network's deflationary efforts to pump the price. Coupled with broader market gloom, INJ token’s doomed days may not be over yet.

Read more

Meta Platforms Earnings: META sinks 10% on lower Q2 revenue guidance Premium

Meta Platforms Earnings: META sinks 10% on lower Q2 revenue guidance

This must be "opposites" week. While Doppelganger Tesla rode horrible misses on Tuesday to a double-digit rally, Meta Platforms produced impressive beats above Wall Street consensus after the close on Wednesday, only to watch the share price collapse by nearly 10%.

Read more

RECOMMENDED LESSONS

7 Ways to Avoid Forex Scams

The forex industry is recently seeing more and more scams. Here are 7 ways to avoid losing your money in such scams: Forex scams are becoming frequent. Michael Greenberg reports on luxurious expenses, including a submarine bought from the money taken from forex traders. Here’s another report of a forex fraud. So, how can we avoid falling in such forex scams?

What Are the 10 Fatal Mistakes Traders Make

Trading is exciting. Trading is hard. Trading is extremely hard. Some say that it takes more than 10,000 hours to master. Others believe that trading is the way to quick riches. They might be both wrong. What is important to know that no matter how experienced you are, mistakes will be part of the trading process.

Strategy

Money Management

Psychology