![]() Sam Seiden
Sam Seiden
Independent Analyst
When using supply and demand to identify turning points in a market, a question that comes up often is, “How far back should I look for a supply and demand level”? The proper answer is this: Look back as far as you need to in order to find fresh demand and supply. The key word is fresh as those represent the highest probability turning points. At those points, you have the highest amount of unfilled buy and sell orders which is ultimately why prices turn.
The OTA Supply and Demand grid has picked consistent turning points since its inception back in March 2012. The reason for the consistency is that we are focused on where banks and financial institutions are buying and selling, their demand and supply, nothing else. In other words, the levels that you see on the grid below are fresh demand and supply. Having this information as an income trader or longer-term investor is key.
Supply Demand Grid 12/01/17 – USDJPY
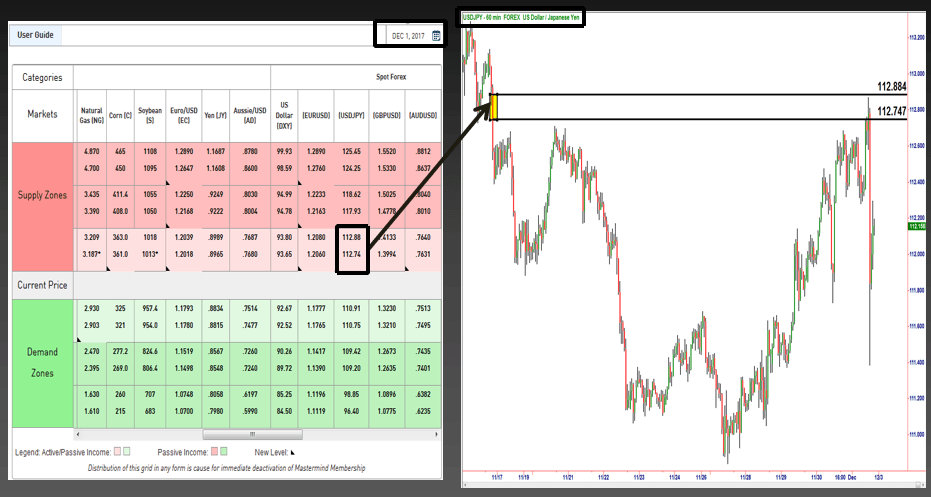
Notice the supply level above. Price declined from that area in strong fashion along with a few of our “odds enhancers” suggesting banks were big sellers of the USDJPY at that level. Half a month later, price rallied back to that level and fell, offering OTA grid members a low risk, high reward and high probability shorting opportunity.
The question many students had was, how that level was found given that the last time price had been there was two weeks ago? While a full explanation is beyond the scope of this piece, we can explore some points of interest in hopes that the information will help take your trading to the next level. Sometimes we look back months and years to find fresh levels, when price is far out on the supply / demand curve. When we looked back, we looked for the picture on the chart that represented fresh demand, and there it was. It also had all our “Odds Enhancers” associated with it which made it a key level, as mentioned above. I am not suggesting that all the same sellers who were trying to sell at that level 2 weeks earlier were still sitting there with sell orders, though many likely are. What the chart does tell us however, is the aggregate supply and demand equation at each price point in a market. If supply didn’t exceed demand at that level, price would not have turned and gone down.
2 Key Points:
-
The key to knowing where market prices are going to turn in advance, and also where prices are going to go, with a very high degree of accuracy means knowing exactly what institution/bank demand and supply looks like on a price chart in any market and at any time frame.
-
Understand that supply and demand levels created long ago can serve to be very strong levels. The fact that they were created long ago is not a bad thing, it’s actually a positive for three reasons. One of which is this… When a level has not been reached in a very long time, it, by definition, is very far out on the supply / demand curve meaning it’s a very high probability opportunity that will almost always have a huge profit zone with it.
Note: All information on this page is subject to change. The use of this website constitutes acceptance of our user agreement. Please read our privacy policy and legal disclaimer. Opinions expressed at FXstreet.com are those of the individual authors and do not necessarily represent the opinion of FXstreet.com or its management. Risk Disclosure: Trading foreign exchange on margin carries a high level of risk, and may not be suitable for all investors. The high degree of leverage can work against you as well as for you. Before deciding to invest in foreign exchange you should carefully consider your investment objectives, level of experience, and risk appetite. The possibility exists that you could sustain a loss of some or all of your initial investment and therefore you should not invest money that you cannot afford to lose. You should be aware of all the risks associated with foreign exchange trading, and seek advice from an independent financial advisor if you have any doubts.
Editors’ Picks

EUR/USD hits two-day highs near 1.1820
EUR/USD picks up pace and reaches two-day tops around 1.1820 at the end of the week. The pair’s move higher comes on the back of renewed weakness in the US Dollar amid growing talk that the Fed could deliver an interest rate cut as early as March. On the docket, the flash US Consumer Sentiment improves to 57.3 in February.

GBP/USD reclaims 1.3600 and above
GBP/USD reverses two straight days of losses, surpassing the key 1.3600 yardstick on Friday. Cable’s rebound comes as the Greenback slips away from two-week highs in response to some profit-taking mood and speculation of Fed rate cuts. In addition, hawkish comments from the BoE’s Pill are also collaborating with the quid’s improvement.

USD/JPY drops back below 157.00, as focus shifts to Japan snap election
USD/JPY is back in the red below 157.00 in the Asian session on Friday. The Japanese Yen recovers ground against the US Dollar amid some profit-taking ahead of Japan's snap general election on Sunday. The preliminary reading of the Michigan Consumer Sentiment Index report for February will be released later on Friday.
Editors’ Picks

EUR/USD: US Dollar to remain pressured until uncertainty fog dissipates Premium
The EUR/USD pair lost additional ground in the first week of February, settling at around 1.1820. The reversal lost momentum after the pair peaked at 1.2082 in January, its highest since mid-2021.

Gold: Volatility persists in commodity space Premium
After losing more than 8% to end the previous week, Gold (XAU/USD) remained under heavy selling pressure on Monday and dropped toward $4,400. Although XAU/USD staged a decisive rebound afterward, it failed to stabilize above $5,000.

GBP/USD: Pound Sterling tests key support ahead of a big week Premium
The Pound Sterling (GBP) changed course against the US Dollar (USD), with GBP/USD giving up nearly 200 pips in a dramatic correction.

Bitcoin: The worst may be behind us
Bitcoin (BTC) price recovers slightly, trading at $65,000 at the time of writing on Friday, after reaching a low of $60,000 during the early Asian trading session. The Crypto King remained under pressure so far this week, posting three consecutive weeks of losses exceeding 30%.

Three scenarios for Japanese Yen ahead of snap election Premium
The latest polls point to a dominant win for the ruling bloc at the upcoming Japanese snap election. The larger Sanae Takaichi’s mandate, the more investors fear faster implementation of tax cuts and spending plans.
RECOMMENDED LESSONS
Making money in forex is easy if you know how the bankers trade!
I’m often mystified in my educational forex articles why so many traders struggle to make consistent money out of forex trading. The answer has more to do with what they don’t know than what they do know. After working in investment banks for 20 years many of which were as a Chief trader its second knowledge how to extract cash out of the market.
5 Forex News Events You Need To Know
In the fast moving world of currency markets where huge moves can seemingly come from nowhere, it is extremely important for new traders to learn about the various economic indicators and forex news events and releases that shape the markets. Indeed, quickly getting a handle on which data to look out for, what it means, and how to trade it can see new traders quickly become far more profitable and sets up the road to long term success.
Top 10 Chart Patterns Every Trader Should Know
Chart patterns are one of the most effective trading tools for a trader. They are pure price-action, and form on the basis of underlying buying and selling pressure. Chart patterns have a proven track-record, and traders use them to identify continuation or reversal signals, to open positions and identify price targets.
7 Ways to Avoid Forex Scams
The forex industry is recently seeing more and more scams. Here are 7 ways to avoid losing your money in such scams: Forex scams are becoming frequent. Michael Greenberg reports on luxurious expenses, including a submarine bought from the money taken from forex traders. Here’s another report of a forex fraud. So, how can we avoid falling in such forex scams?
What Are the 10 Fatal Mistakes Traders Make
Trading is exciting. Trading is hard. Trading is extremely hard. Some say that it takes more than 10,000 hours to master. Others believe that trading is the way to quick riches. They might be both wrong. What is important to know that no matter how experienced you are, mistakes will be part of the trading process.
The challenge: Timing the market and trader psychology
Successful trading often comes down to timing – entering and exiting trades at the right moments. Yet timing the market is notoriously difficult, largely because human psychology can derail even the best plans. Two powerful emotions in particular – fear and greed – tend to drive trading decisions off course.