![]() Rick Wright
Rick Wright
Online Trading Academy
Hello traders! This week’s newsletter comes to you from cold and dry southwest Colorado. Staring at the beautiful scenery has prompted this week’s topic, which is trading breakouts. How could a mountain view inspire a trading topic? Read on and find out!
First of all, we need to define what a breakout actually is. Investopedia.com defines a break out as:
A price movement through an identified level of support or resistance, which is usually followed by heavy volume and increased volatility. Traders will buy the underlying asset when the price breaks above a level of resistance and sell when it breaks below support.
Obviously, we need to refine this definition for Online Trading Academy use! Instead of resistance, we would say supply; instead of support, we would say demand. This is not to say that supply and demand is the same as support and resistance! Many new students make that mistake. We are trying to define where institutions have their massive orders set up, which we call supply and demand. Support and resistance is usually expressed as a single data point on a chart; because we believe that it is impossible for institutions to get their massive orders filled at one price, we use a range or a zone of their orders, hence the supply and demand. There is much more to it than this, but it is time to move on!
In the following chart, I’ve marked in a resistance line in blue and a support line in red. The blue 1 is what many traders marked as resistance, and when price broke above that line at the blue arrow, they went long. The red 2 is what many traders marked as support, and when price broke below that line at the red arrow, they went short.
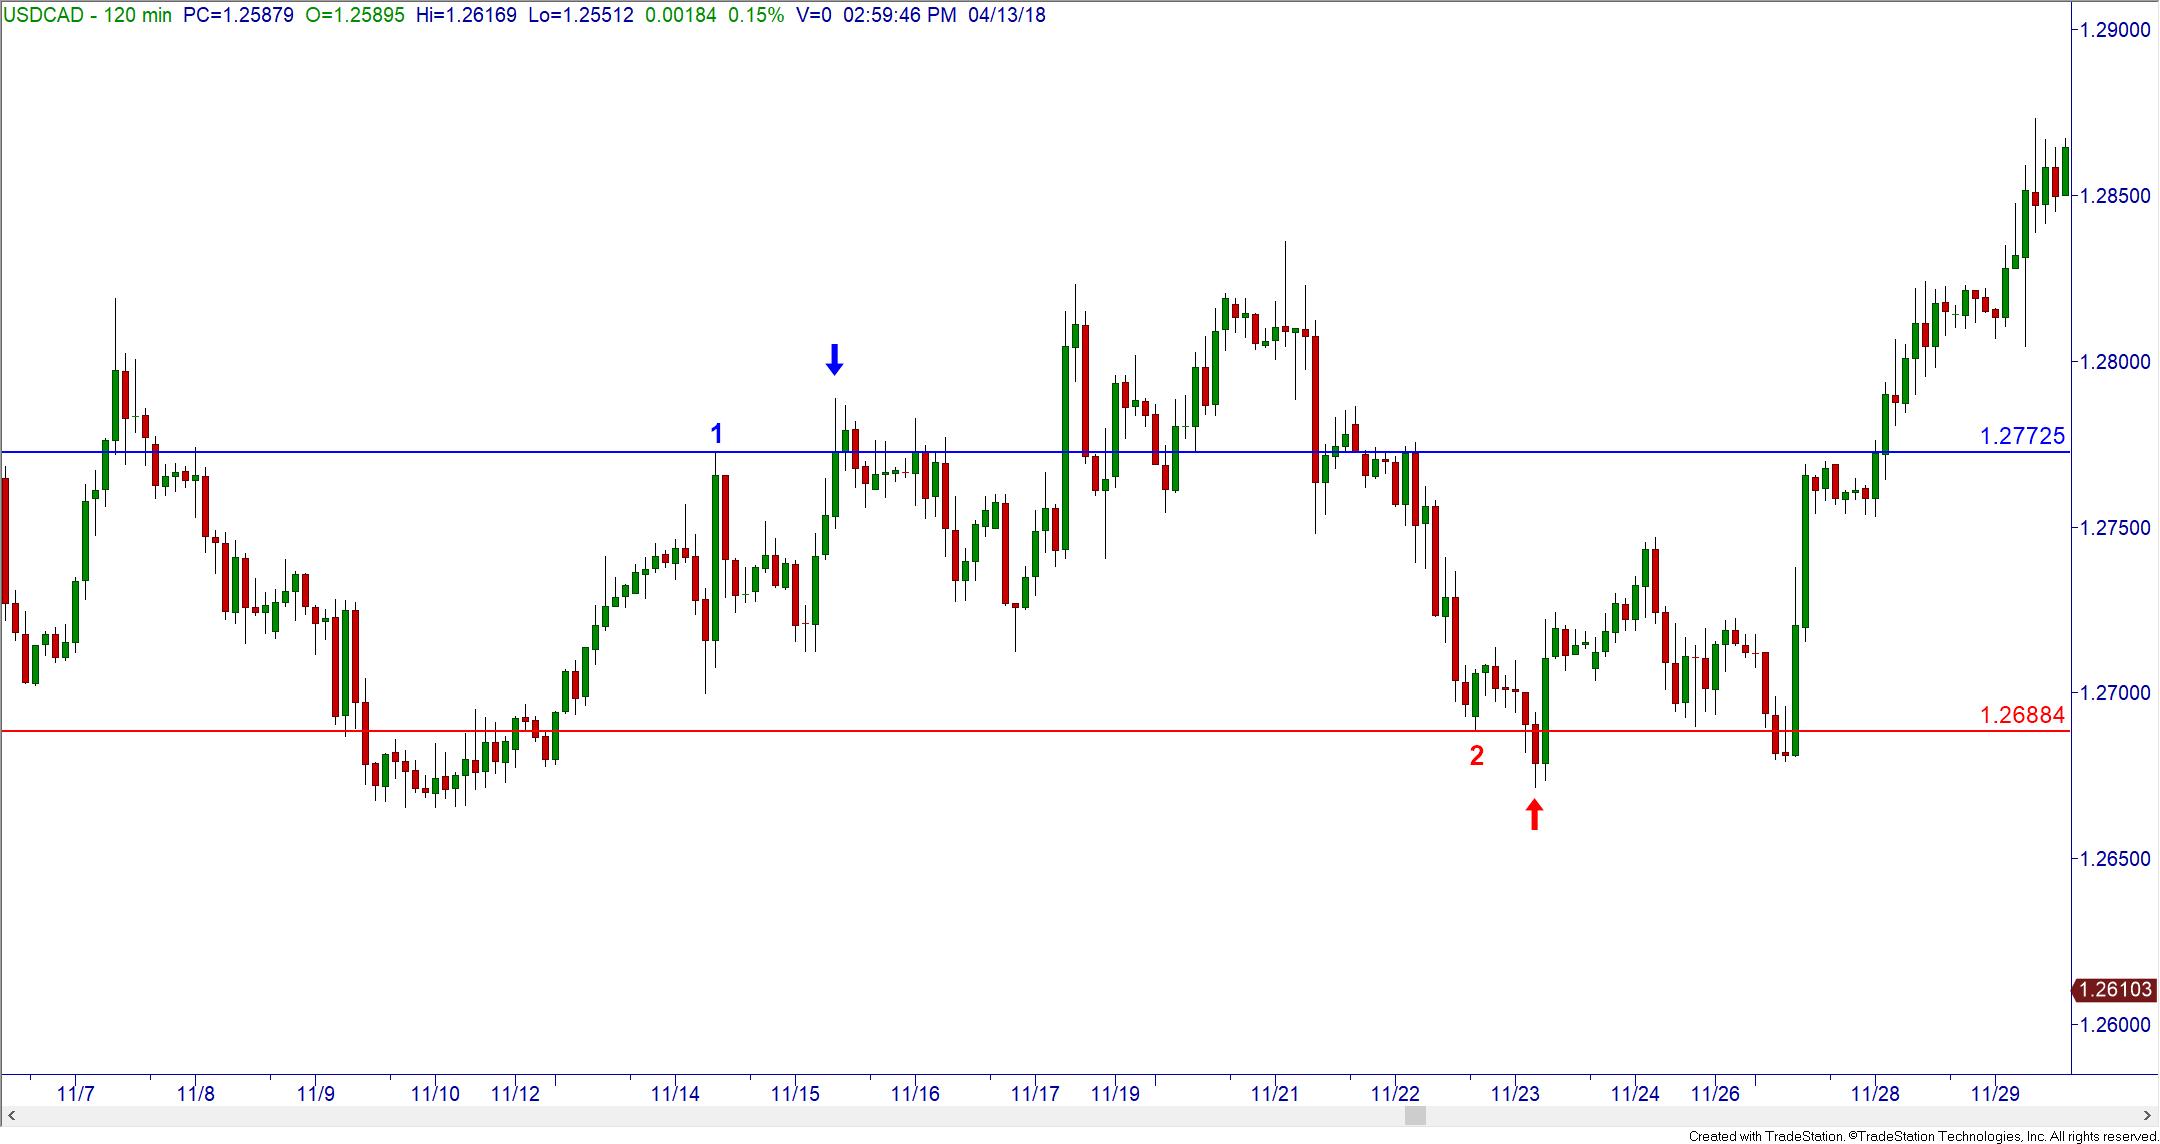
Notice anything odd about these trade locations? These breakout traders are buying AFTER price has gone up, where it is expensive to buy! They are also selling AFTER price has gone down, where it is too cheap to sell! Hopefully they don’t do this technique too many times before they find out that it rarely works…
Using the same chart but drawing in supply and demand zones instead, this is what it would look like for Online Trading Academy trades:

The demand zone from the point marked 3 had enough demand to break past the previously marked resistance area. As a trader, it is my job to buy at the least expensive price possible. Instead of buying at the expensive breakout price, I want to patiently wait for price to come back to the demand zone that had enough power to break past the resistance line. That entry is where price came back to the zone at point marked 4-giving you a much better entry price, and a higher probability that the trade will work out in your favor.
With the breakdown short trade marked on the first chart, I would prefer to BUY when prices are cheap, as previously mentioned. So, when the breakdown traders are selling hoping for a big move down, I am looking to BUY at the demand zone marked at 5 when price returns to the zone, at the point marked 6.
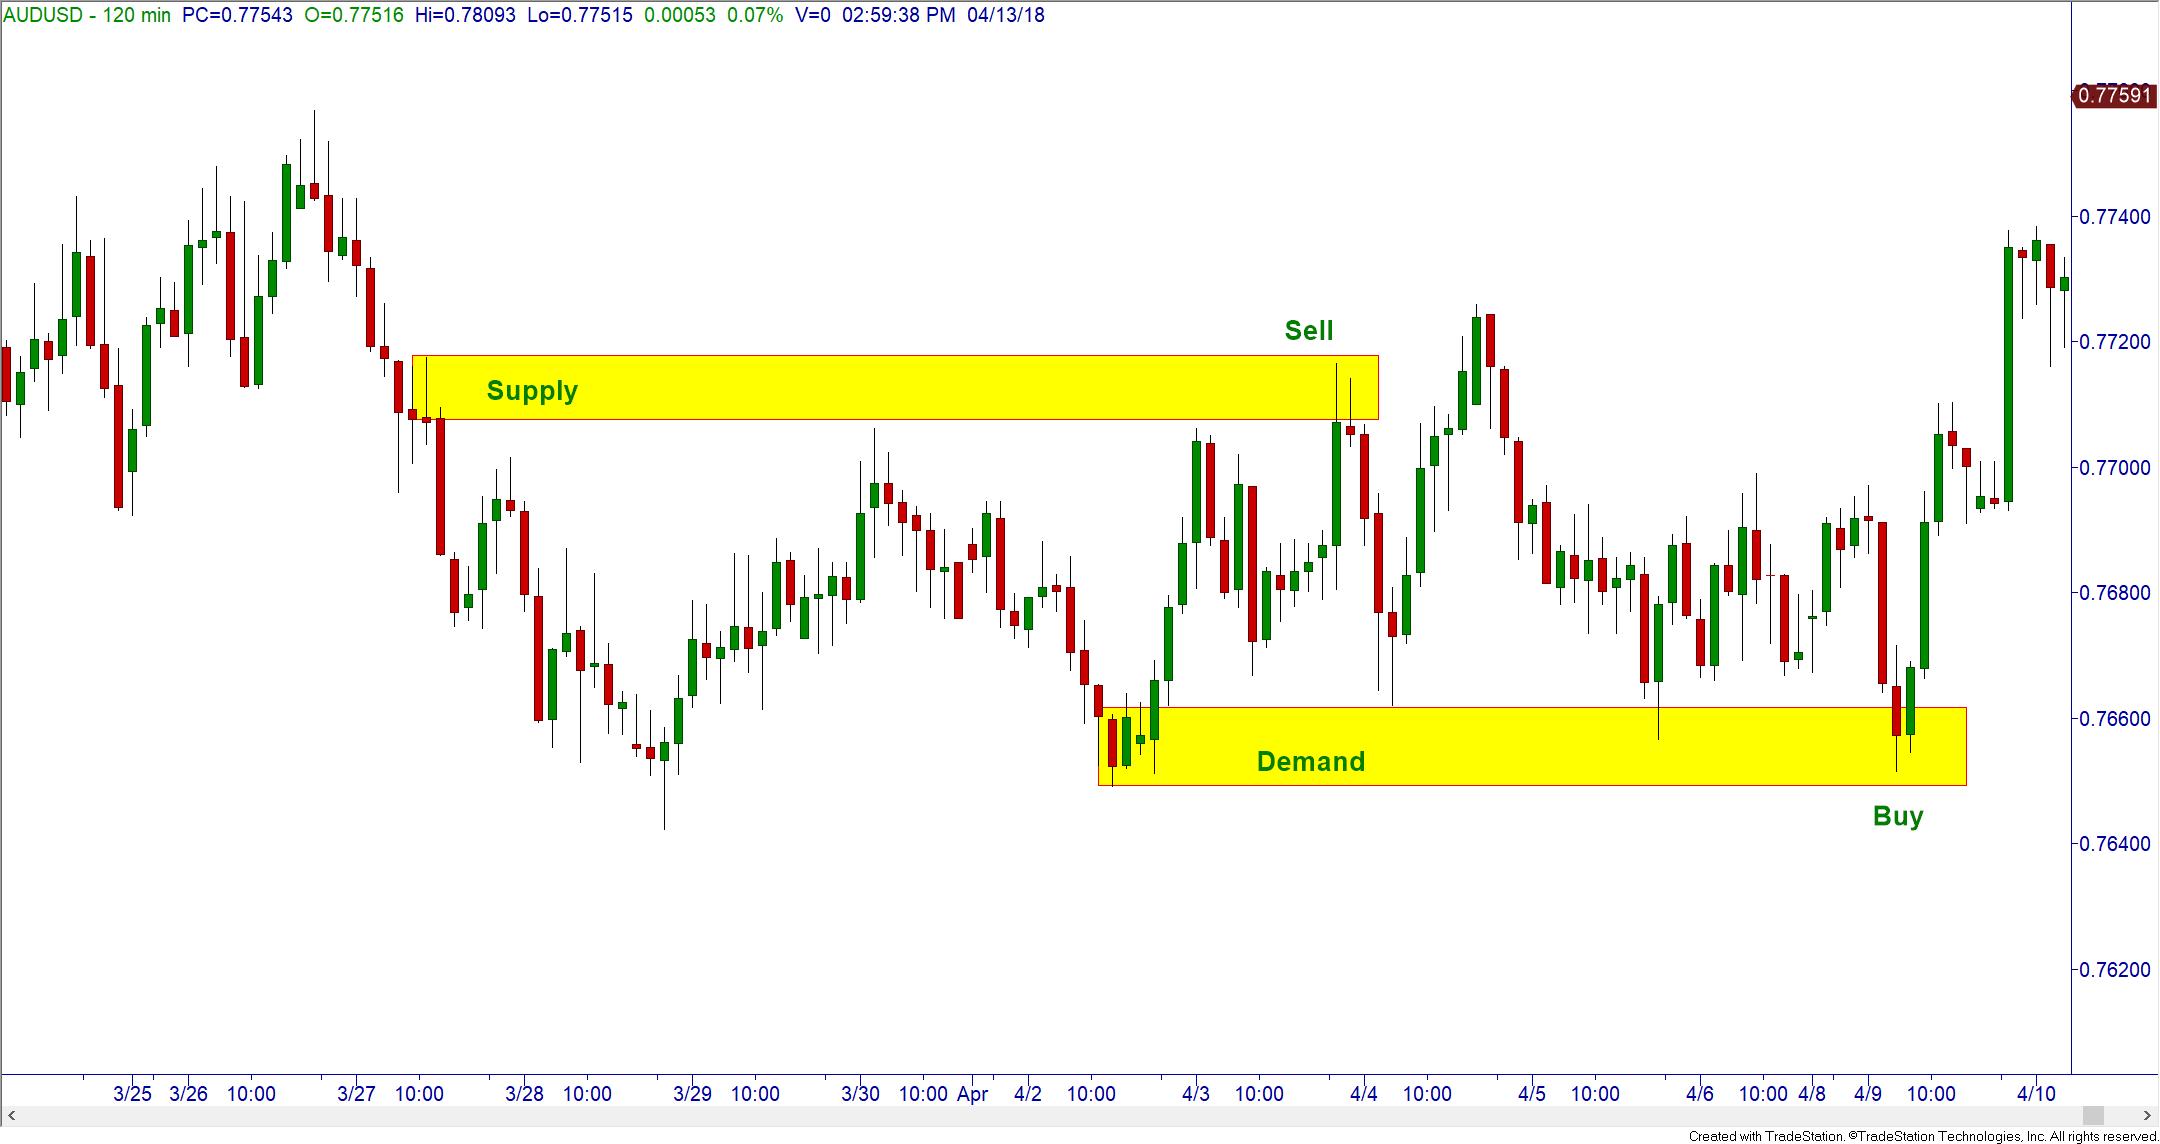
Here is one more chart to demonstrate more thoroughly. I did not mark in the resistance or support lines, only a single supply zone and a single demand zone. When price rallied up to that supply zone, you can see that it broke past a couple of previous swing highs – resistance in this case. Where some traders are looking to buy, I believe selling when price is relatively expensive in a good supply zone will increase the chance of this trade working out. For the long trade here, when price broke down to the demand zone, it had broken past a couple of obvious swing lows/support lines. When it got down to the marked demand zone, the smarter trade was to buy when the price was cheap!
Now, step back a bit and look at the price action on the charts. Notice how the sideways market looks a bit like a mountain range? Eventually, everything you look at turns into a trading reference. Weird, I know.
Please note that this technique works extremely well for sideways markets. Trading up or down trending markets is slightly different; we look to buy pullbacks to demand in uptrends and sell retracements to supply in downtrends. More details will be coming up in a future newsletter!
This content is intended to provide educational information only. This information should not be construed as individual or customized legal, tax, financial or investment services. As each individual's situation is unique, a qualified professional should be consulted before making legal, tax, financial and investment decisions. The educational information provided in this article does not comprise any course or a part of any course that may be used as an educational credit for any certification purpose and will not prepare any User to be accredited for any licenses in any industry and will not prepare any User to get a job. Reproduced by permission from OTAcademy.com click here for Terms of Use: https://www.otacademy.com/about/terms
Editors’ Picks

EUR/USD hovers around nine-day EMA above 1.1800
EUR/USD remains in the positive territory after registering modest gains in the previous session, trading around 1.1820 during the Asian hours on Monday. The 14-day Relative Strength Index momentum indicator at 54 is edging higher, signaling improving momentum. RSI near mid-50s keeps momentum balanced. A sustained push above 60 would firm bullish control.

GBP/USD holds medium-term bullish bias above 1.3600
The GBP/USD pair trades on a softer note around 1.3605 during the early European session on Monday. Growing expectation of the Bank of England’s interest-rate cut weighs on the Pound Sterling against the Greenback.

USD/JPY drops back below 157.00 on Japan's verbal intervention
USD/JPY has come under moderate selling pressure below 157.00 in the Asian session on Monday. The Japanese Yen lost ground to near 157.70 following Japan’s ruling Liberal Democratic Party's outright majority win in Sunday’s lower house election, opening the door to more fiscal stimulus by Prime Minister Sanae Takaichi. However, JPY buyers jumped back and dragged the pair southward on FX verbal intervention by Japan’s Finance Minister Katayama.
Editors’ Picks
EUR/USD hovers around nine-day EMA above 1.1800
EUR/USD remains in the positive territory after registering modest gains in the previous session, trading around 1.1820 during the Asian hours on Monday. The 14-day Relative Strength Index momentum indicator at 54 is edging higher, signaling improving momentum. RSI near mid-50s keeps momentum balanced. A sustained push above 60 would firm bullish control.

Gold sticks to gains above $5,000 as China's buying and Fed rate-cut bets drive demand
Gold surges past the $5,000 psychological mark during the Asian session on Monday in reaction to the weekend data, showing that the People's Bank of China extended its buying spree for a 15th month in January. Moreover, dovish US Federal Reserve expectations and concerns about the central bank's independence drag the US Dollar lower for the second straight day, providing an additional boost to the non-yielding yellow metal.
GBP/USD holds medium-term bullish bias above 1.3600
The GBP/USD pair trades on a softer note around 1.3605 during the early European session on Monday. Growing expectation of the Bank of England’s interest-rate cut weighs on the Pound Sterling against the Greenback.

Bitcoin, Ethereum and Ripple consolidate after massive sell-off
Bitcoin, Ethereum, and Ripple prices consolidated on Monday after correcting by nearly 9%, 8%, and 10% in the previous week, respectively. BTC is hovering around $70,000, while ETH and XRP are facing rejection at key levels.

Weekly column: Saturn-Neptune and the end of the Dollar’s 15-year bull cycle
Tariffs are not only inflationary for a nation but also risk undermining the trust and credibility that go hand in hand with the responsibility of being the leading nation in the free world and controlling the world’s reserve currency.
RECOMMENDED LESSONS
Making money in forex is easy if you know how the bankers trade!
I’m often mystified in my educational forex articles why so many traders struggle to make consistent money out of forex trading. The answer has more to do with what they don’t know than what they do know. After working in investment banks for 20 years many of which were as a Chief trader its second knowledge how to extract cash out of the market.
5 Forex News Events You Need To Know
In the fast moving world of currency markets where huge moves can seemingly come from nowhere, it is extremely important for new traders to learn about the various economic indicators and forex news events and releases that shape the markets. Indeed, quickly getting a handle on which data to look out for, what it means, and how to trade it can see new traders quickly become far more profitable and sets up the road to long term success.
Top 10 Chart Patterns Every Trader Should Know
Chart patterns are one of the most effective trading tools for a trader. They are pure price-action, and form on the basis of underlying buying and selling pressure. Chart patterns have a proven track-record, and traders use them to identify continuation or reversal signals, to open positions and identify price targets.
7 Ways to Avoid Forex Scams
The forex industry is recently seeing more and more scams. Here are 7 ways to avoid losing your money in such scams: Forex scams are becoming frequent. Michael Greenberg reports on luxurious expenses, including a submarine bought from the money taken from forex traders. Here’s another report of a forex fraud. So, how can we avoid falling in such forex scams?
What Are the 10 Fatal Mistakes Traders Make
Trading is exciting. Trading is hard. Trading is extremely hard. Some say that it takes more than 10,000 hours to master. Others believe that trading is the way to quick riches. They might be both wrong. What is important to know that no matter how experienced you are, mistakes will be part of the trading process.
The challenge: Timing the market and trader psychology
Successful trading often comes down to timing – entering and exiting trades at the right moments. Yet timing the market is notoriously difficult, largely because human psychology can derail even the best plans. Two powerful emotions in particular – fear and greed – tend to drive trading decisions off course.