A lack of evidence often accompanies poor trades.
Trading with insufficient evidence leads to increased outcome variability due to omitting various crucial circumstances.
What comes next?
Excessive variability hinders the development of reliable and consistent trading strategies. But it also takes an emotional toll.
This lack of evidence fuels indecision and anxiety during trades, making an already challenging endeavour even more demanding. Agree?
But even though uncertainty is fundamental to trading - evidence stacking builds confidence - helping you overcome indecision and the discomfort of not knowing the market's next move.
In a minute
You'll see how stacked evidence improves outcomes and combats indecision and the uncertainty of being in a live trade. Let's go!
The 60-minute chart below indicates a strong upward trend in the Australian dollar.
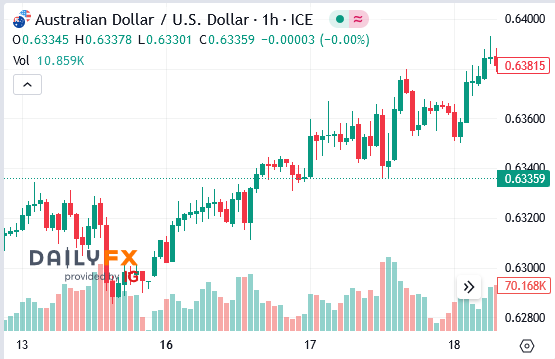
A deep dive into inventory positioning tells you despite the market closing sharply lower the prior week - significant buying accumulation days before was 'unfazed' by the end-of-week drop in price. They continue to hold their new acquisitions.
Conclusion
If institutions have been buying aggressively and few are willing to transact at prices below their buying - all indications suggest a market bottom (in the short term). Agree?
Notably the market has surged 100 basis points. Should you buy?
Context is king
There's no denying price is trending upward.
And considering the volume traded it confirms 'value' is rising. Yet the following trade centres around a short opportunity.
First
While it's true price always comes back to value - in the short term - it can do anything.
This holds particularly true when influential market participants are absent in anticipation of news releases.
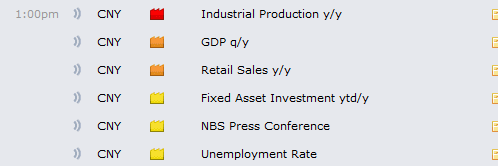
Pending is a slate of economic releases from China.
Therefore it's plausible to consider a move counter to the current upward trend due to:
Weak-handed longs being shaken out, and/or
The opening of markets in other regions prompting a reduction in exposure (selling) in anticipation of economic data.
What does the evidence say?
In a second you'll see analysis derived from uncommon trading methods.These concepts and analysis are not easily accessible to most people - which makes them reliable.
But it's not important to grasp how each evidence point is calculated. Your takeaway is how powerful stacking evidence is as a robust trading approach.
With that in mind
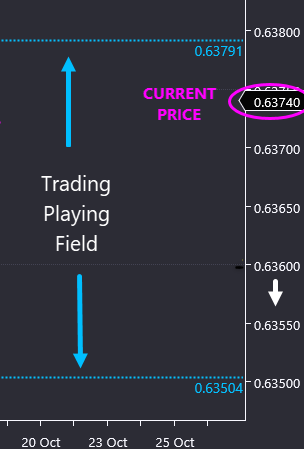
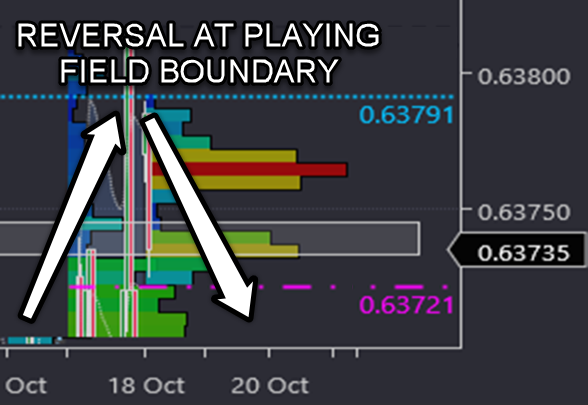
The first step is identifying where you can and can't trade through trading playing fields.
This considerably diminishes the likelihood of entering or holding a trade at a level where the price might reverse against you.
With the market trading at 0.6374 - that's a green light to trade.
What follows are several points of supporting evidence. As supporting evidence - they're not your ticket to enter the trade - they're merely building a strong case for a short trade.
In the chart below, not only is price trading within the permissible trading field, it's also showing:
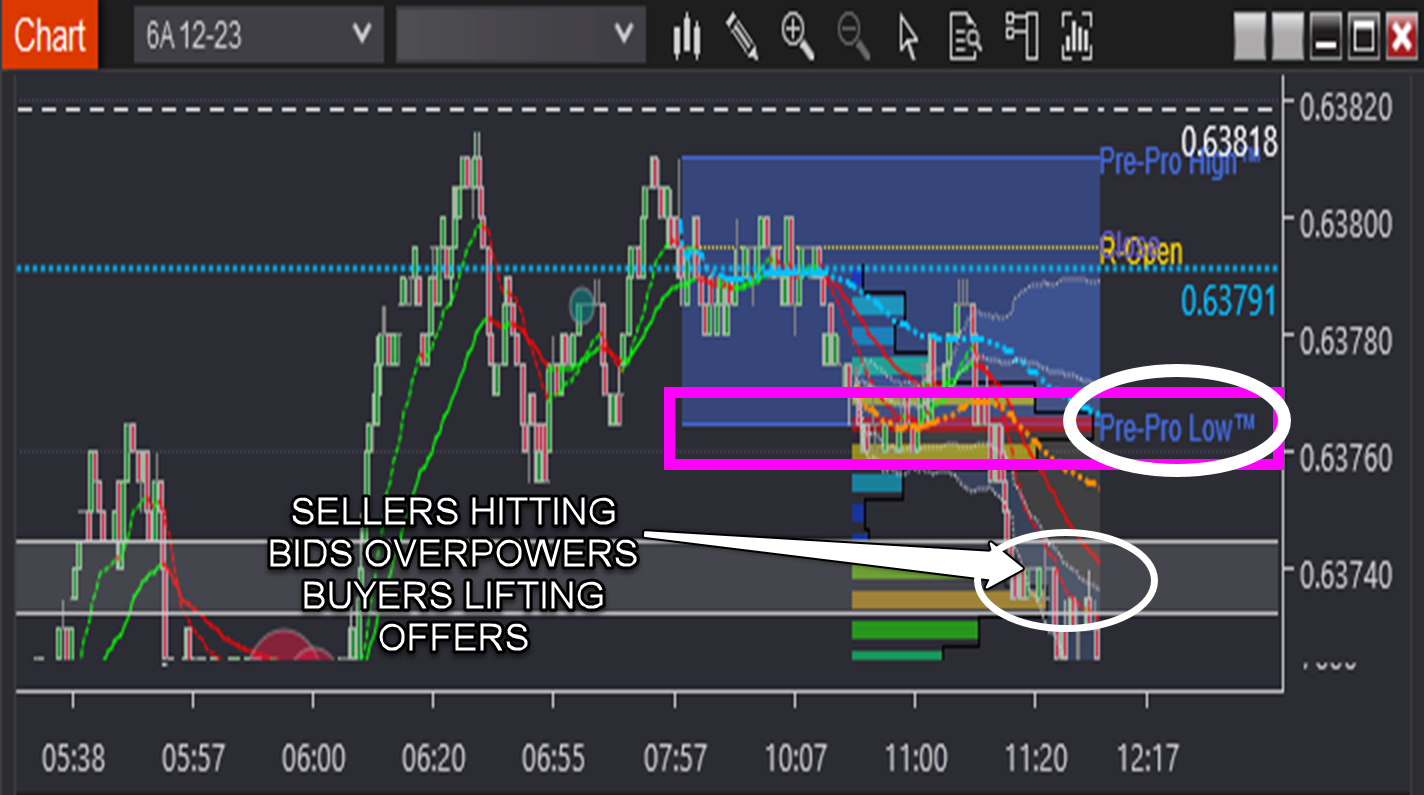
Price failed to break above a key relative value level unique to the traders operating in the Asian time zone. This is considered to have 'bearish' consequences in the short term.
A large group of aggressive sellers are now 'onside'. For aggressive buyers positioned above this level, the expectation of short sellers getting trapped and pushing prices higher is no longer a viable strategy. Make sense?
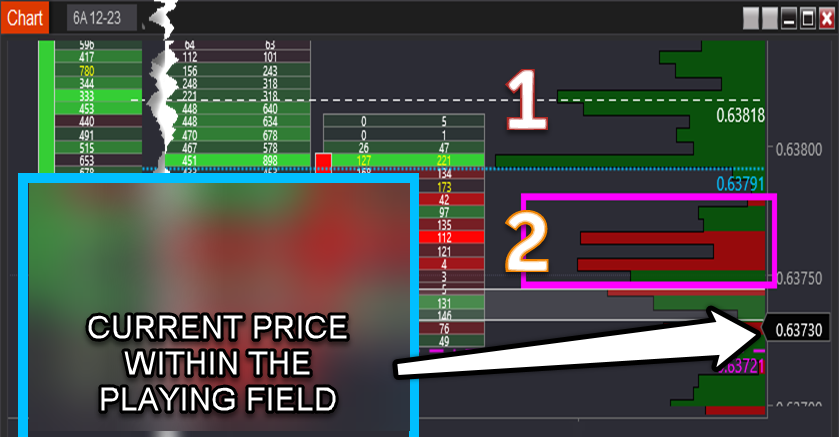
3. When the price fails to break a playing field boundary - it often reverses. It's an incredibly reliable trade strategy if you're stacking evidence multiples. As such it serves as a third point of evidence.
4. When sellers and buyers go head to head and sellers are the victors - sellers are 'offering the market lower'. When this occurs below a proprietary calculation - the Pre-Pro Low™ - it provides additional evidence supporting price moving lower.
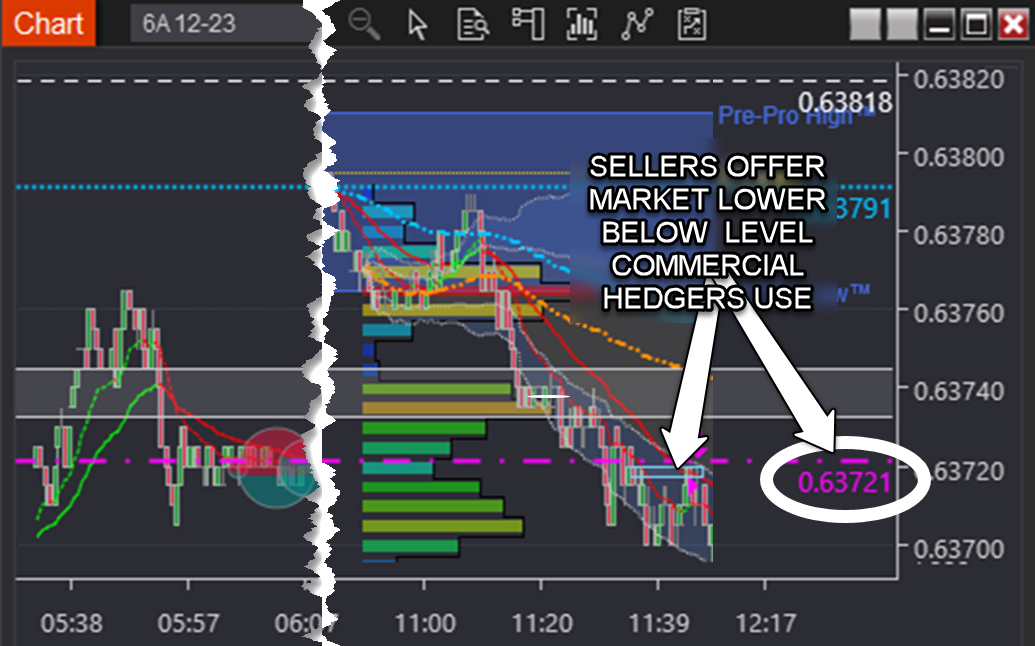
5.When sellers offer the market lower below a key level commercial hedgers pay attention to - it acts as further evidence supporting lower price movement.
You identify the above points of evidence during your daily trading game planning. So you're not under time pressure to identify everything on the spot.
However the next step is identifying additional evidence points in real-time - enabling you to 'connect the dots' for a high-probability trade.
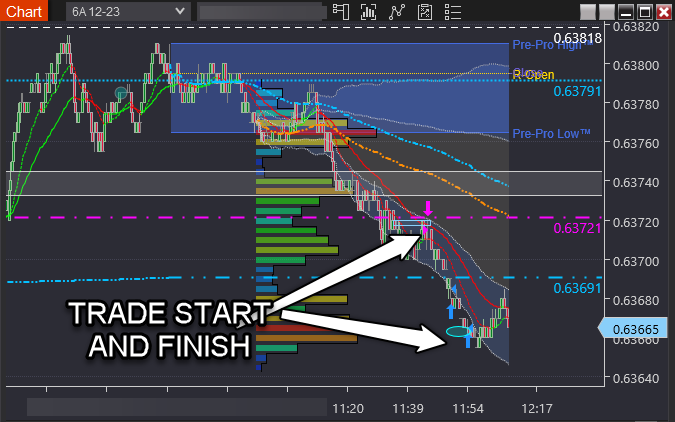
The chart below displays the execution, following the preceding seven additional points of evidence.
Note: specific details are not disclosed in the interest of maintaining a competitive trading advantage. This extends to the rationale for the final exit.
Remaining points of evidence
Behaviours align with an additional data-backed playbook trade.
A 2nd and 3rd deviation theme of a unique VWAP calculation is in play.
A downward price skew exists on two collaborating uniquely configured views (which is bearish).
Price is currently trading below CME and a unique VWAP calculation.
Price is consistently positioned to one side of the EMA's on a unique view (specifics not disclosed).
Sellers hitting bids is pushing the market lower (real-time tape reading).
A seasonal covering move is currently impacting price owing to the opening of another regional market (specific details not disclosed).
Less apparent is the role stacked evidence plays in timing your entries to maintain 'tight' risk.
Maintaining tight risk allows you to scale up your relative position size, leading to more substantial payouts without relying on significant price movements in the market.
This plays a vital role in achieving consistent performance because smaller moves in price are more likely to occur over chasing large moves.
Imagine only taking trades with a minimum of 10 points of evidence.
Now you're filtering trade selection for a selection of trades each day with the highest odds of success. You remove the negative impact of sub-par trades and over-trading - enhancing performance and self-confidence.
Further
As your timing improves you alleviate the anxiety of enduring trades that immediately go against you. Make sense?
But 10's a lot! And 7 are in real-time?
Ever watched a drummer using two feet and two hands independently?
Drummers start with the hands. The incorporation of their feet is introduced gradually.
Similarly
If you commence with 4 points of evidence - over time observing 4-5 points of evidence while executing trades becomes automatic. Once you reach this stage you can gradually incorporate additional points - aiming for 10 or more per trade.
To clarify
Having only 4 points of evidence does not provide the same level of robustness and odds as stacking 12 points of evidence.
But think of it like this...
When you're entering a trade based on 10 or more points of evidence - how many other people you're competing against are doing the same? Exactly!
This should serve as your incentive to strive for 10 points or greater.
Forex and derivatives trading is a highly competitive and often extremely fast-paced environment. It only rewards individuals who attain the required level of skill and expertise to compete. Past performance is not indicative of future results. There is a substantial risk of loss to unskilled and inexperienced players. The high degree of leverage can work against you as well as for you. Before deciding to trade any such leveraged products you should carefully consider your investment objectives, level of experience, and risk appetite. The possibility exists that you could sustain a loss of some or all of your initial investment and therefore you should not invest money that you cannot afford to lose. You should be aware of all the risks associated with trading on margin, and seek advice from an independent
Editors’ Picks

EUR/USD faces next resistance near 1.1930
EUR/USD continues to build on its recovery in the latter part of Wednesday’s session, with upside momentum accelerating as the pair retargets the key 1.1900 barrier amid a further loss of traction in the US Dollar. Attention now shifts squarely to the US data docket, with labour market figures and the always influential CPI releases due on Thursday and Friday, respectively.

GBP/USD slips heading into the Thursday trading window
The Pound Sterling pulled back from four-year highs on Wednesday, weighed down by a combination of Bank of England dovishness and UK political uncertainty, even as the US Dollar weakened on soft labor market revisions.

USD/JPY strengthens above 153.00 despite stronger US jobs data
The USD/JPY pair attracts some sellers to around 153.20 during the early Asian session on Thursday. The Japanese Yen strengthens against the US Dollar in the aftermath of Prime Minister Sanae Takaichi's landslide election victory. The attention will shift to the US Consumer Price Index inflation report, which is due later on Friday.
Editors’ Picks

AUD/USD bulls pause amid post-NFP USD rebound
AUD/USD is trading with a mild negative bias during the Asian session on Thursday, below a three-year high set the previous day. The US Dollar looks to build on Wednesday's upbeat US NFP-inspired bounce from an over one-week low, acting as a headwind for spot prices. However, the divergent Fed-RBA expectations, along with the underlying bullish sentiment, should help limit any meaningful corrective fall for the risk-sensitive Aussie.
USD/JPY strengthens above 153.00 despite stronger US jobs data
The USD/JPY pair attracts some sellers to around 153.20 during the early Asian session on Thursday. The Japanese Yen strengthens against the US Dollar in the aftermath of Prime Minister Sanae Takaichi's landslide election victory. The attention will shift to the US Consumer Price Index inflation report, which is due later on Friday.

Gold posts modest gains above $5,050 as US-Iran tensions persist despite strong labor data
Gold price trades in positive territory near $5,060 during the early Asian session on Thursday. The precious metal edges higher despite stronger-than-expected US employment data. The release of the US Consumer Price Index inflation report will take center stage later on Friday.

Bitcoin holds steady despite strong US labour market
Bitcoin briefly bounced from $66,000 to above $68,000 but slightly reversed those gains following Wednesday's US January jobs report. The top crypto is hovering around $67,000, down 2% over the past 24 hours as of writing on Wednesday.

The market trades the path not the past
The payroll number did not just beat. It reset the tone. 130,000 vs. 65,000 expected, with a 35,000 whisper. 79 of 80 economists leaning the wrong way. Unemployment and underemployment are edging lower. For all the statistical fog around birth-death adjustments and seasonal quirks, the core message was unmistakable. The labour market is not cracking.
RECOMMENDED LESSONS
Making money in forex is easy if you know how the bankers trade!
I’m often mystified in my educational forex articles why so many traders struggle to make consistent money out of forex trading. The answer has more to do with what they don’t know than what they do know. After working in investment banks for 20 years many of which were as a Chief trader its second knowledge how to extract cash out of the market.
5 Forex News Events You Need To Know
In the fast moving world of currency markets where huge moves can seemingly come from nowhere, it is extremely important for new traders to learn about the various economic indicators and forex news events and releases that shape the markets. Indeed, quickly getting a handle on which data to look out for, what it means, and how to trade it can see new traders quickly become far more profitable and sets up the road to long term success.
Top 10 Chart Patterns Every Trader Should Know
Chart patterns are one of the most effective trading tools for a trader. They are pure price-action, and form on the basis of underlying buying and selling pressure. Chart patterns have a proven track-record, and traders use them to identify continuation or reversal signals, to open positions and identify price targets.
7 Ways to Avoid Forex Scams
The forex industry is recently seeing more and more scams. Here are 7 ways to avoid losing your money in such scams: Forex scams are becoming frequent. Michael Greenberg reports on luxurious expenses, including a submarine bought from the money taken from forex traders. Here’s another report of a forex fraud. So, how can we avoid falling in such forex scams?
What Are the 10 Fatal Mistakes Traders Make
Trading is exciting. Trading is hard. Trading is extremely hard. Some say that it takes more than 10,000 hours to master. Others believe that trading is the way to quick riches. They might be both wrong. What is important to know that no matter how experienced you are, mistakes will be part of the trading process.
The challenge: Timing the market and trader psychology
Successful trading often comes down to timing – entering and exiting trades at the right moments. Yet timing the market is notoriously difficult, largely because human psychology can derail even the best plans. Two powerful emotions in particular – fear and greed – tend to drive trading decisions off course.