I’d like to share an indicator I came up with that I found very useful over the years. It’s actually a very simple one but it proved itself against over and over again against much more complicated indicators that try to do the same thing. I surely wouldn’t want to miss it.
Here’s the formula: abs(open-close)/(high-low) * 100
Which gives us a value between 0 and 100 that measures the actual price change of a single price bar (absolute value of open-close) against the whole price bars range (high-low). Or in Candlestick charting language: measures the size of the candle body against the whole candle including the wicks.
Let’s look at a price chart to make this more clear:
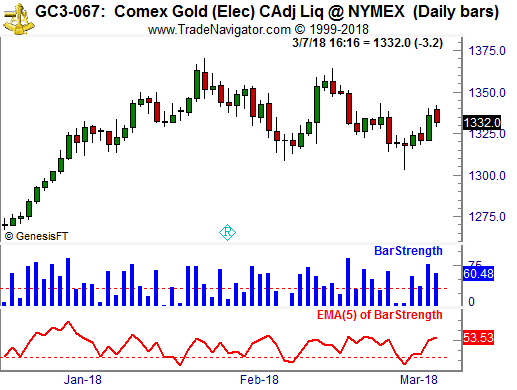
The blue bars are showing the Daily BarStrength of Gold for each of the price bars/candles. Below you can find a 5 period EMA of that BarStrength. Notice that huge green candles that open nearby the low and close nearby the high show a high BarStrength score (50+) while candles that close near the open have a very low score.
So what you might wonder. Well here’s the interesting part: Notice that quite often you’ll get a strong price bar/candle after a weak one and the other way around. To highlight this I’ve plotted a horizontal line at 33.
The same is true on a larger scale looking at the moving average below. When it’s showing low values, meaning there’s been hardly any real price change in Gold for a couple of days, there’s a tendency for big moves to happen afterward.
I’ve found this to be true in many markets, Gold is just an example. While this works in principle on any timeframe, it’s most effective on higher timeframes like daily and weekly charts.
The BarStrength indicator doesn’t show you in which direction the market will move. But knowing when a market is more likely to make a big move than not can make a really huge difference in your trading results. This is why I like to use this as a filter for breakout strategies, like ORB (opening range breakout) strategies for example.
Happy Trading!
CFTC RULE 4.41 - HYPOTHETICAL OR SIMULATED PERFORMANCE RESULTS HAVE CERTAIN LIMITATIONS. UNLIKE AN ACTUAL PERFORMANCE RECORD, SIMULATED RESULTS DO NOT REPRESENT ACTUAL TRADING. ALSO, SINCE THE TRADES HAVE NOT BEEN EXECUTED, THE RESULTS MAY HAVE UNDER-OR-OVER COMPENSATED FOR THE IMPACT, IF ANY, OF CERTAIN MARKET FACTORS, SUCH AS LACK OF LIQUIDITY. SIMULATED TRADING PROGRAMS IN GENERAL ARE ALSO SUBJECT TO THE FACT THAT THEY ARE DESIGNED WITH THE BENEFIT OF HINDSIGHT. NO REPRESENTATION IS BEING MADE THAT ANY ACCOUNT WILL OR IS LIKELY TO ACHIEVE PROFIT OR LOSSES SIMILAR TO THOSE SHOWN.
Editors’ Picks
EUR/USD Price Annual Forecast: Growth to displace central banks from the limelight in 2026 Premium
What a year! Donald Trump’s return to the United States (US) Presidency was no doubt what led financial markets throughout 2025. His not-always-unexpected or surprising decisions shaped investors’ sentiment, or better said, unprecedented uncertainty.
Gold Price Annual Forecast: 2026 could see new record-highs but a 2025-like rally is unlikely Premium
Gold hit multiple new record highs throughout 2025. Trade-war fears, geopolitical instability and monetary easing in major economies were the main drivers behind Gold’s rally.
GBP/USD Price Annual Forecast: Will 2026 be another bullish year for Pound Sterling? Premium
Having wrapped up 2025 on a positive note, the Pound Sterling (GBP) eyes another meaningful and upbeat year against the US Dollar (USD) at the start of 2026.
US Dollar Price Annual Forecast: 2026 set to be a year of transition, not capitulation Premium
The US Dollar (USD) enters the new year at a crossroads. After several years of sustained strength driven by US growth outperformance, aggressive Federal Reserve (Fed) tightening, and recurrent episodes of global risk aversion, the conditions that underpinned broad-based USD appreciation are beginning to erode, but not collapse.
Bitcoin Price Annual Forecast: BTC holds long-term bullish structure heading into 2026
Bitcoin (BTC) is wrapping up 2025 as one of its most eventful years, defined by unprecedented institutional participation, major regulatory developments, and extreme price volatility.
RECOMMENDED LESSONS
Making money in forex is easy if you know how the bankers trade!
I’m often mystified in my educational forex articles why so many traders struggle to make consistent money out of forex trading. The answer has more to do with what they don’t know than what they do know. After working in investment banks for 20 years many of which were as a Chief trader its second knowledge how to extract cash out of the market.
5 Forex News Events You Need To Know
In the fast moving world of currency markets where huge moves can seemingly come from nowhere, it is extremely important for new traders to learn about the various economic indicators and forex news events and releases that shape the markets. Indeed, quickly getting a handle on which data to look out for, what it means, and how to trade it can see new traders quickly become far more profitable and sets up the road to long term success.
Top 10 Chart Patterns Every Trader Should Know
Chart patterns are one of the most effective trading tools for a trader. They are pure price-action, and form on the basis of underlying buying and selling pressure. Chart patterns have a proven track-record, and traders use them to identify continuation or reversal signals, to open positions and identify price targets.
7 Ways to Avoid Forex Scams
The forex industry is recently seeing more and more scams. Here are 7 ways to avoid losing your money in such scams: Forex scams are becoming frequent. Michael Greenberg reports on luxurious expenses, including a submarine bought from the money taken from forex traders. Here’s another report of a forex fraud. So, how can we avoid falling in such forex scams?
What Are the 10 Fatal Mistakes Traders Make
Trading is exciting. Trading is hard. Trading is extremely hard. Some say that it takes more than 10,000 hours to master. Others believe that trading is the way to quick riches. They might be both wrong. What is important to know that no matter how experienced you are, mistakes will be part of the trading process.
The challenge: Timing the market and trader psychology
Successful trading often comes down to timing – entering and exiting trades at the right moments. Yet timing the market is notoriously difficult, largely because human psychology can derail even the best plans. Two powerful emotions in particular – fear and greed – tend to drive trading decisions off course.
