With the next Bitcoin halving expected to happen under a month (May 12, 2020), a significant number of users believe that this will create a bullish run for BTC as halving decreases its inflation. In this article, we’ll use historical data to explore how to trade halvings from an events arbitrage perspective.


Looking at historical data

In April 2020, we experienced halvings for both Bitcoin Cash (BCH) and Bitcoin SV (BSV) on Apr 8 and Apr 10 respectively. Let’s look at their price graphs against BTC only so as to remove the noise created by market movements:

BCH and BSV on Apr 8

BCH and BSV on Apr 10

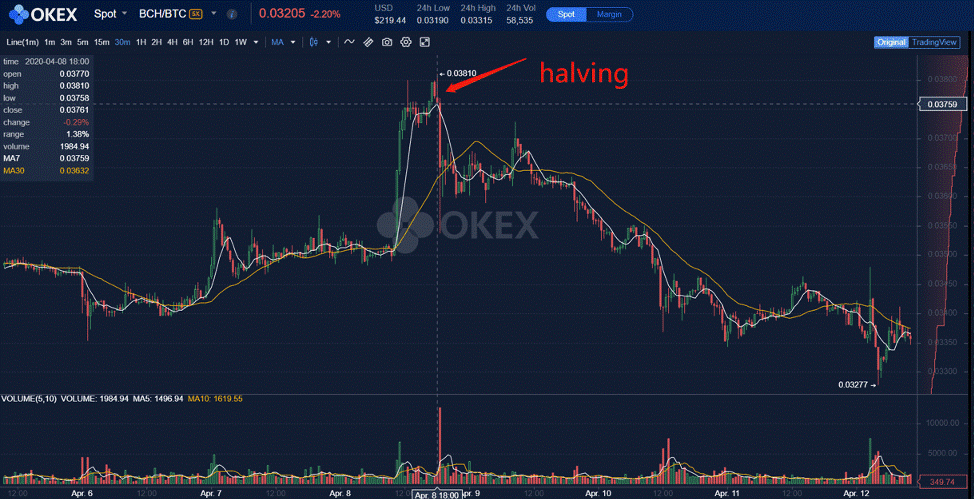
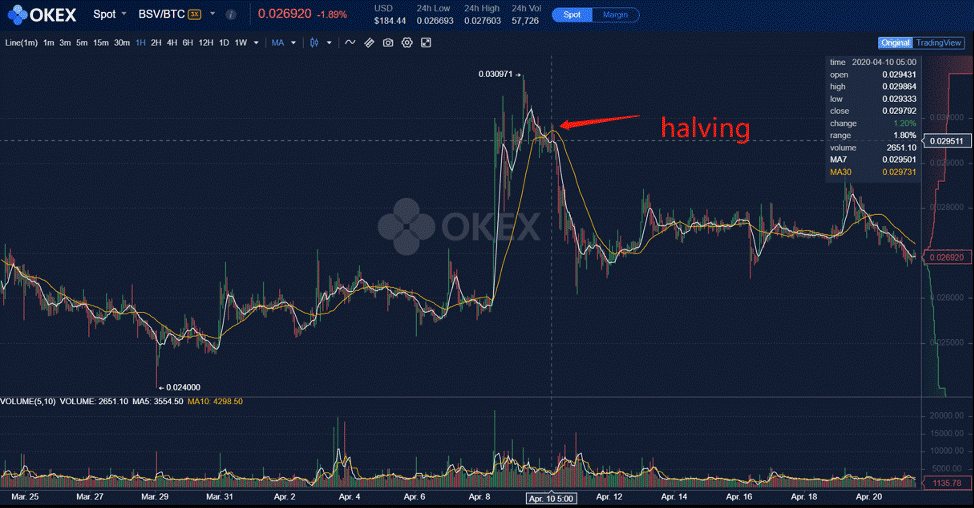
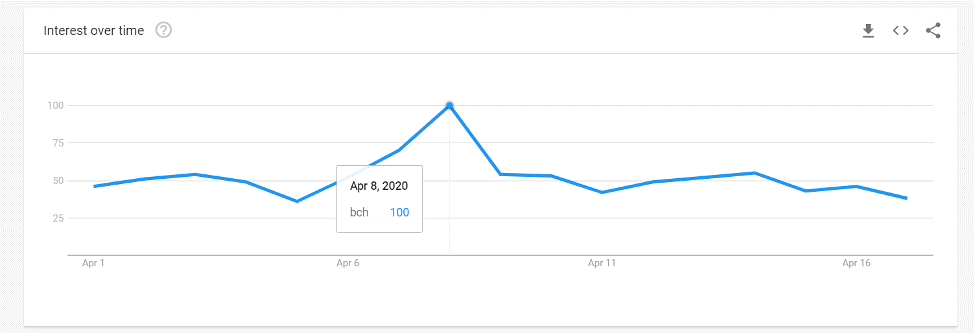
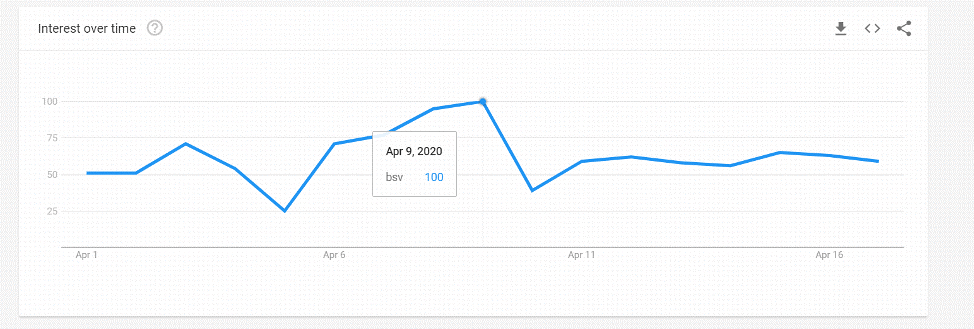
We can observe that the price peaks on the halving date. As a quantitative trader, I believe the price of assets in the short-term is driven by supply and demand. The fundamental aspect of decreased inflation that causes price increase can be ignored in the short-term. We can imagine that the price is at the highest point when the market is sentiment is high due to all the news surrounding the halving. Take a look at the Google Trend screenshots below. It shows that the search for BCH and BSV peaked right at the time of halving, meaning demand is at its highest. Therefore, in theory, we can buy the rumor and sell the news.

Google Trend during BCH Halving

Google Trend during BSV Halving


Backtesting the Long Short Strategy

We can see that the Google Trend usually begins to rise about 3 days before halving, peaks on the halving date, and then goes down after halving. Using the past halving data of LTC (halved on Aug 5, 2019), BCH and BSV, we can propose a simple trade to long before halving, short on the halving date, and unwind the final position 3 days after halving.

We can perform 3 trades against the BTC quote pair to remove noise from the market: Buy ~1 BTC of the halving coin 3 days prior to halving, short ~1 BTC on the halving date, then unwind 3 days after halving to net a total of 33.84% return, with an average 11.28% return on each trade.

Example:

LTC

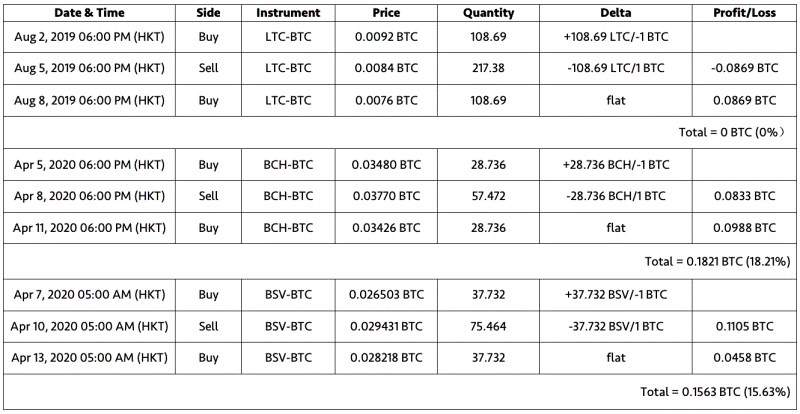
The total return will be around 0.3384 BTC (33.84%), with an average return of 11.28%.


How to trade the upcoming BTC halving

This simple back test shows that there is alpha when you “buy rumor, sell news” for small-cap coins. However, applying this to trade BTC is different and there is no easy way to hedge the market. In the examples above, we are essentially delta flat as we are constantly buying or selling BTC against the halving coin. But for a similar BTC trade, we need to either take delta by trading it against USD or USDT with OKEx Margin Lending or USDT swap; or alternatively hedge it with ETH. It will be up to traders themselves to determine which is the best cause of action.


Conclusion

Today we looked at an event arbitrage trading strategy to long a halving coin before halving and then short it right after halving. To summarize, the theory behind is that due to the heated discussion and news on halving, the demand for that coin will increase prior to the event; but as the news die down after it halves, the buying pressure is gone and the coin price would drop. We’ve backtested the strategy on 3 coins against BTC to remain delta neutral. It is now up to traders to decide whether we apply this trading logic to the upcoming BTC halving in May.

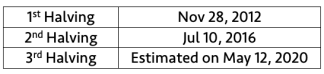
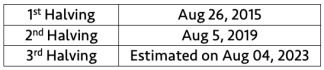
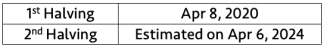
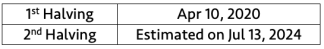
Halving dates for different coins:

fxsoriginal

fxsoriginal

fxsoriginal

fxsoriginal

fxsoriginal

fxsoriginal


This material should not be taken as the basis for making investment decisions, nor be construed as a recommendation to engage in investment transactions. Trading digital assets involves significant risk and can result in the loss of your invested capital. You should ensure that you fully understand the risk involved and take into consideration your level of experience, investment objectives and seek independent financial advice if necessary.

Editors’ Picks

EUR/USD trims losses and returns to the 1.1750 area

EUR/USD trims losses and returns to the 1.1750 area

The US Dollar resumed its decline in the American afternoon, helping EUR/USD trim early losses. The pair trades around 1.1750 as market participants gear up for the European Central Bank monetary policy decision and the United States Consumer Price Index.

GBP/USD consolidates above mid-1.3300s as traders await BoE and US CPI report

GBP/USD consolidates above mid-1.3300s as traders await BoE and US CPI report

The GBP/USD pair struggles to capitalize on the overnight bounce from the 1.3310 area, or a one-week low, and oscillates in a narrow band during the Asian session on Thursday. Spot prices currently trade around the 1.3370 region, down less than 0.10% for the day, as traders opt to wait on the sidelines ahead of the key central bank event risk and US consumer inflation data.

USD/JPY climbs above 155.50 as traders await US CPI release

USD/JPY climbs above 155.50 as traders await US CPI release

The USD/JPY pair rises to around 155.60 during the early Asian session on Thursday. The US Dollar edges higher against the Japanese Yen on the cautious comments from Federal Reserve Governor Christopher Waller. Traders will keep an eye on the US Consumer Price Index inflation data for November, which will be released later on Thursday.


Editors’ Picks

AUD/USD slides to two-week low, below 0.6600 as traders await US CPI

AUD/USD slides to two-week low, below 0.6600 as traders await US CPI

The AUD/USD drops to a two-week low during the Asian session on Thursday amid a weaker risk tone, which benefits the safe-haven US Dollar and weighs on the Aussie for the sixth consecutive day. Apart from this, China's economic woes further undermine the Australian Dollar, though the RBA's hawkish stance could limit losses. Furthermore, bets for more rate cuts by the Fed might cap the USD and lend support to the currency pair ahead of the US inflation figures later today.

USD/JPY climbs above 155.50 as traders await US CPI release

USD/JPY climbs above 155.50 as traders await US CPI release

The USD/JPY pair rises to around 155.60 during the early Asian session on Thursday. The US Dollar edges higher against the Japanese Yen on the cautious comments from Federal Reserve Governor Christopher Waller. Traders will keep an eye on the US Consumer Price Index inflation data for November, which will be released later on Thursday.

Gold declines on profit-taking, USD strength ahead of US CPI release

Gold declines on profit-taking, USD strength ahead of US CPI release

Gold price edges lower below $4,350 during the Asian trading hours on Thursday. The precious metal retreats from seven-week highs amid some profit-taking and a rebound in the US Dollar (USD). The potential downside for the yellow metal might be limited after the recent US jobs data reinforce market expectations of further interest rate cuts by the US Federal Reserve and drag the USD lower. 

Bitcoin, Ethereum whipsaw, sparks heavy liquidations amid accusations of market manipulation

Bitcoin, Ethereum whipsaw, sparks heavy liquidations amid accusations of market manipulation

The crypto market whipsawed on Wednesday as top cryptocurrencies, including Bitcoin (BTC) and Ethereum (ETH), quickly reversed gains from the early American session.

Monetary policy: Three central banks, three decisions, the same caution

Monetary policy: Three central banks, three decisions, the same caution

While the Fed eased its monetary policy on 10 December for the third consecutive FOMC meeting, without making any guarantees about future action, the BoE, the ECB and the BoJ are holding their respective meetings this week. 

RECOMMENDED LESSONS

5 Forex News Events You Need To Know

In the fast moving world of currency markets where huge moves can seemingly come from nowhere, it is extremely important for new traders to learn about the various economic indicators and forex news events and releases that shape the markets. Indeed, quickly getting a handle on which data to look out for, what it means, and how to trade it can see new traders quickly become far more profitable and sets up the road to long term success.

Top 10 Chart Patterns Every Trader Should Know

Chart patterns are one of the most effective trading tools for a trader. They are pure price-action, and form on the basis of underlying buying and selling pressure. Chart patterns have a proven track-record, and traders use them to identify continuation or reversal signals, to open positions and identify price targets.

7 Ways to Avoid Forex Scams

The forex industry is recently seeing more and more scams. Here are 7 ways to avoid losing your money in such scams: Forex scams are becoming frequent. Michael Greenberg reports on luxurious expenses, including a submarine bought from the money taken from forex traders. Here’s another report of a forex fraud. So, how can we avoid falling in such forex scams?

What Are the 10 Fatal Mistakes Traders Make

Trading is exciting. Trading is hard. Trading is extremely hard. Some say that it takes more than 10,000 hours to master. Others believe that trading is the way to quick riches. They might be both wrong. What is important to know that no matter how experienced you are, mistakes will be part of the trading process.

Strategy

Money Management

Psychology

Best Brokers of 2025