Anyone connected to the financial markets industry knows just how difficult it is to accurately predict price changes, duration and the amplitude of trends. Billions of dollars are spent annually on research derived from varying models, economic, fundamental analysis, mathematical algorithms and even artificial intelligence programmes. But is there efficiency – has market analysis improved over the last several decades since the computer revolution?
It seems that more complex ways are being experimented in order to predict price trends but that hasn’t revolutionised the industry. Most large asset managers employ huge teams to outperform major indices which provide the benchmark for performance but most active managers are left either underperforming or are marginally ahead of the game. When you consider all the twists and turns in a market trend, adding those together over a year, it accounts to a far greater percentage swing than just a trend that measures its starting point in January and its completion in December. Which means there’s a lot of wastage – inefficiency.
So, it was no surprise to read a recent report from CNBC which ran its story around a senior research analyst working for a major Oil brokerage company based in London, U.K. The analyst commented in its latest research note that ‘There are so many uncertainties surrounding the oil market that it makes it virtually impossible to predict developments for the rest of the week let alone for months or a year ahead’. The report went on ‘There are economic and geopolitical developments to deal with and these can change almost on a daily basis’. The analyst described oil market conditions as a ‘forecasting nightmare’.
Now I’m the first to be sympathetic – I know just how difficult it can be to predict future price development several months in advance. Many analysts have climbed to fame over one maybe two historic calls – a few names, unmentioned here rose to notoriety during the financial-crisis collapse of 2007-09 but have since faded from view – yes, because it’s difficult.
Most analysts pick their way through short-term calls which are about 3-5% per cent away from current levels, erratic as that performance may be – it’s a bit like two fleas playing ping-pong (table-tennis) on the back of a dog – they have some idea of the limits of the balls movement but absolutely no idea about the direction of the dog.
But there’s a methodology that moves away from the ‘incrementalist’ idea of ‘linear-thinking’ which is better tuned into the concept that markets are non-linear progressions of action/reaction processes – and that’s the Elliott Wave (EW) methodology.
Our specialisation in the EW model has produced some uncanny market calls over the last 25+ years, across all asset classes. Many cannot be scrutinised as random forecasts because of the sheer complexity of pattern, form, price amplitude and duration employed in that analysis. If you’re a mathematician and understand the probability of forecasting such trends, then you’ll know that to predict something so arcuate would be hundreds-of-thousands against – and if repeated, is so mathematically improbable that the only reasoning would be to confirm that there is an underlying law that is being applied in the process.
So when it comes to Crude Oil analysis, let’s see whether the Elliott Wave model has merits.
The next six charts represent a Track Record of EW price forecasts published in WaveTrack International’s bi-weekly and/or monthly analysis covering the last 3-year period.
Exhibit 1 – January 9th 2016
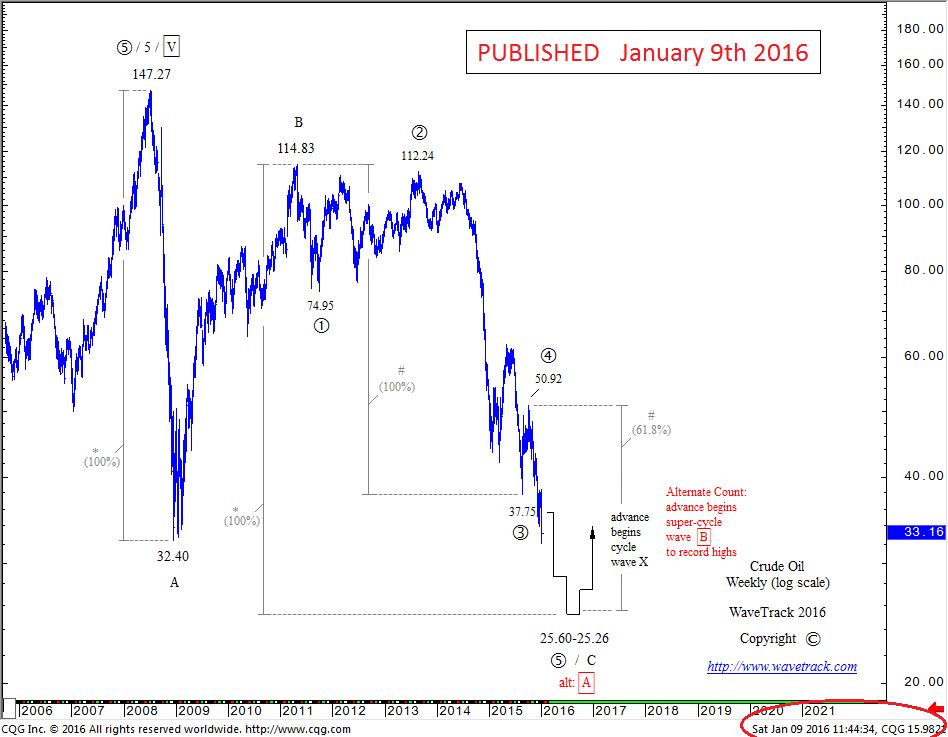
Crude Oil is engaged in a three price-swing zig zag decline that began from the July ’08 all-time-record high of $147.27, labelled A-B-C. Basis Elliott Wave and Fib-Price-Ratio analysis, wave C downside targets were measured towards $25.60-25.26+/-. The price at the time of this analysis was at 33.16 which means it was forecasting a decline of approx. $7.50 dollars but then ending the entire zig zag pattern/decline from $147.27, then staging a reversal to begin a new uptrend.
Exhibit 2 – May 10th 2016
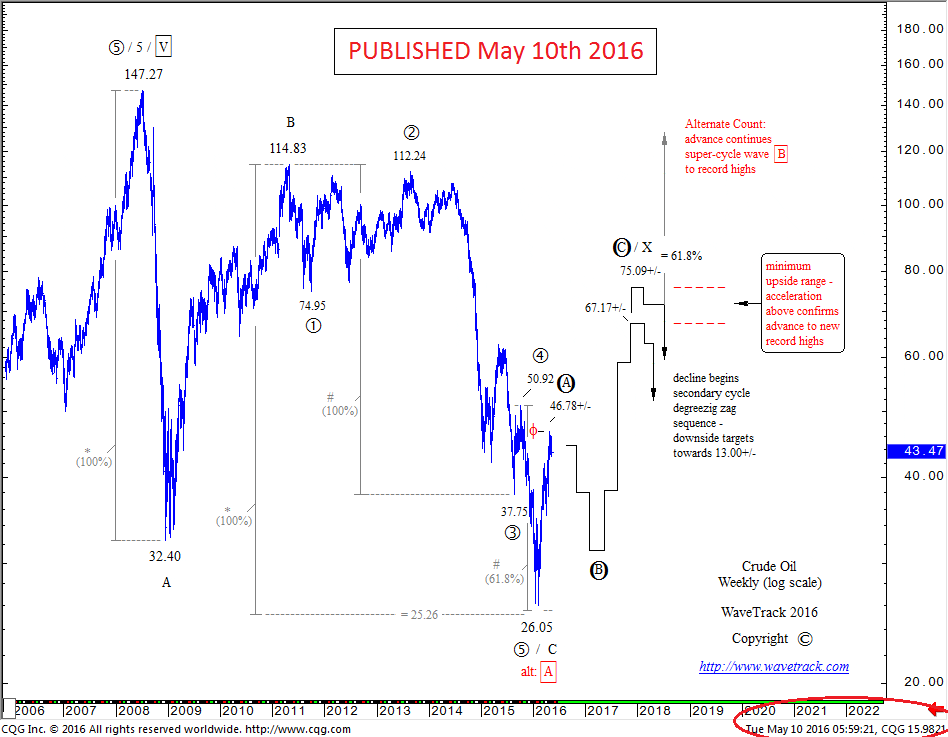
Crude Oil ended the three price-swing zig zag decline at 26.05, just $0.45 cents from the projected low. Coincidence? Hardly! The price responded not by any fundamental news at the time – sentiment was very bearish then – but it instead responded to the Laws that define price development as seen through the Elliott Wave Principle. Crude Oil was already trading up to $43.47, a recovery of +66% per cent. And not only that, the updated analysis then projected prices unfolding higher but within specific parameters, or conditions – the advance must unfold higher into a three price-swing formation, labelled A-B-C, and amplitude analysis using Fib-Price-Ratios predicted the advance would end towards $75.09+/-, then turn down dramatically afterwards.
Exhibit 3 – August 26th 2018
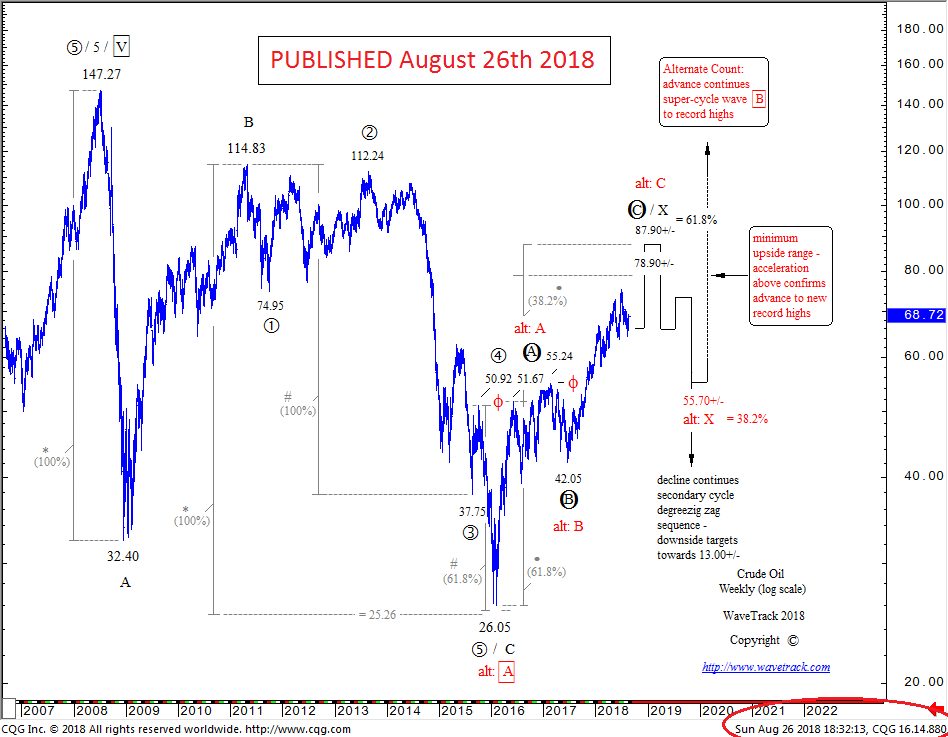
It’s taken over 2½ years for the A-B-C zig zag upswing to develop and only in Aug.’18 is it approaching original upside targets of $75.09+/-, now revised to $78.90+/-. But the pattern isn’t quite finished – a little more upside was forecast from current levels of $68.72 to $78.90+/-. Afterwards, a big downswing would begin with initial targets towards 55.70+/-.
Exhibit 4 – November 22nd 2018
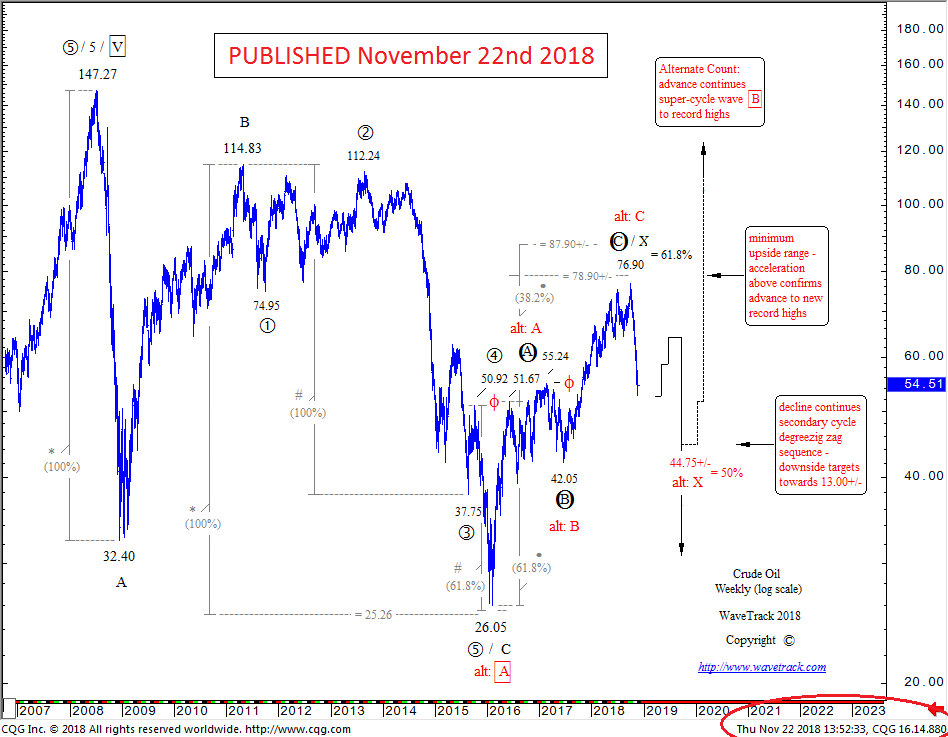
Crude Oil traded up to $76.90 in late-October, ending the A-B-C zig zag pattern that was forecast almost 3-years earlier to $75.09-78.90+/-! The next forecast predicted a decline towards min. $55.70+/-, revised here towards $44.75+/-.
Exhibit 5 – January 9th 2019
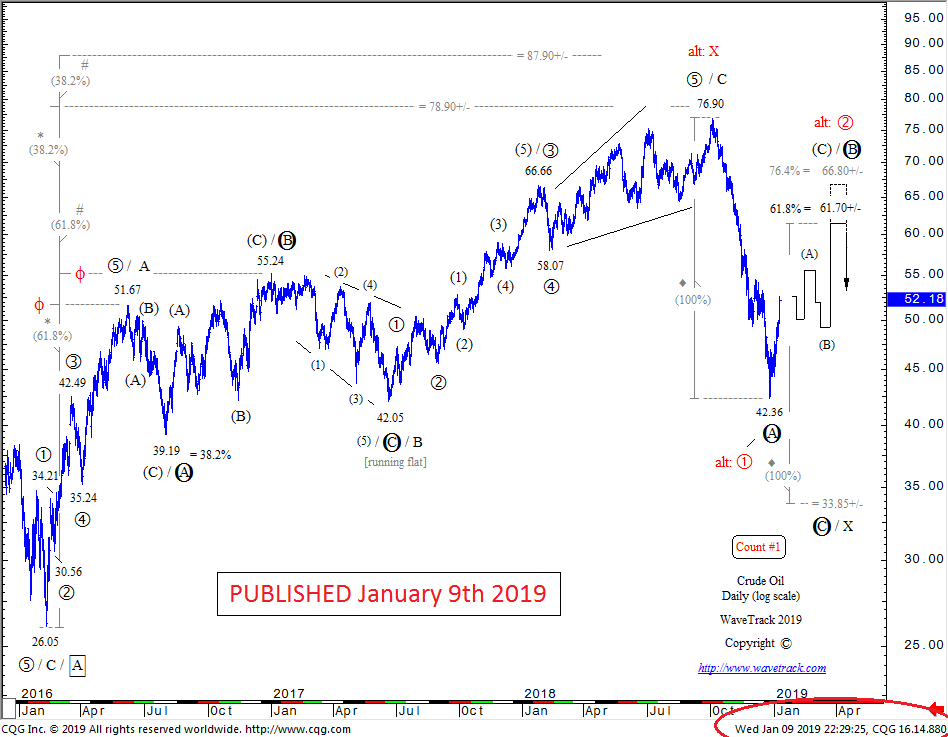
Price declines continued down to a final low at $42.36, a massive drop of $34.54 dollars or a -44.9% per cent decline. Elliott Wave analysis then forecast a three price-swing zig zag pattern developing to the upside over several months, labelled (A)-(B)-(C) – upside projections were to min. $61.70+/-, max. $66.80+/-.
Exhibit 6 – April 11th 2019
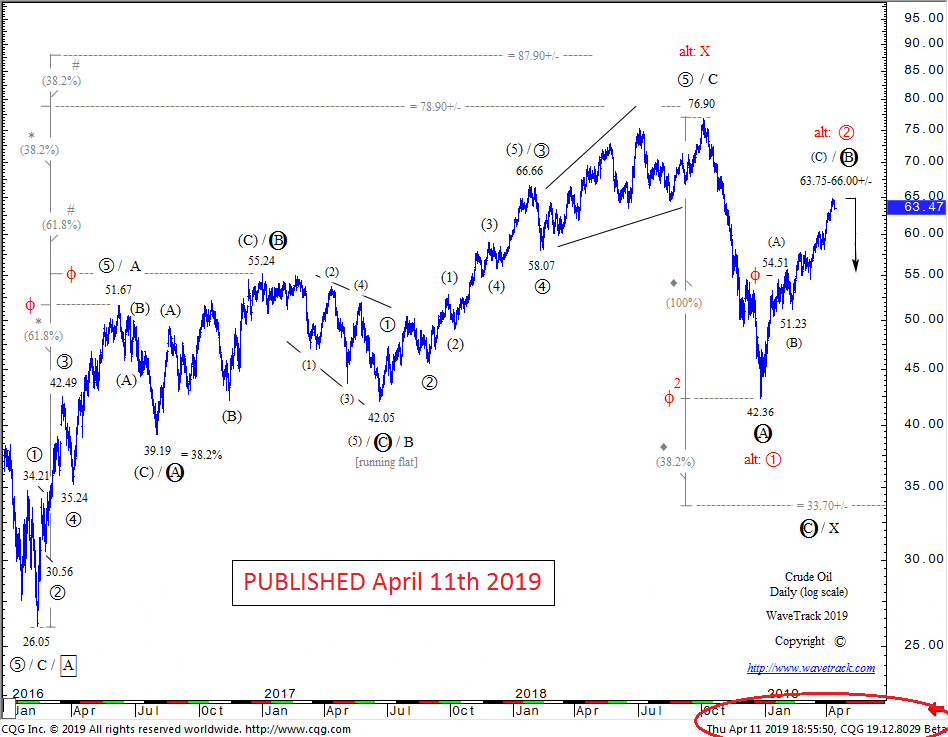
Crude Oil ran higher, exactly as predicted, unfolding into a three price-swing zig zag pattern, (A)-(B)-(C) with price targets being reached at 64.79 (April 8th). Analysis now predicts a sharp downswing over the next several months, towards $33.70+/-.
Conclusion
The overall form and price-forecasts presented in these six charts over a 3-year period developed almost perfectly according to the Universal Laws governing the Elliott Wave Principle. Even a casual eye will notice the predictability in price development and its accuracy can only result in one conclusion – an inherent, mysterious law is governing the price development of all financial/commodity/currency markets – if those laws are known, understood, then accurate price prediction is certainly possible
WaveTrack International and its related publications apply R.N.Elliott's "The Wave Principle" to historical market price activity which categorises and interprets the progress of future price patterns according to this methodology. Whilst it may be reasonable to deduce a course of action regarding investments as a result of such application, at no time or on any occasion will specific securities, futures, options or commodities of any kind be recommended for purchase or sale. Publications containing forecasts are therefore intended for information purposes only. Any opinion contained in these reports is only a statement of our views and are based on information we believe to be reliable but no guarantee is given as to its accuracy or completeness. Markets are volatile and therefore subject to rapid an unexpected price changes. Any person relying on information contained in these reports does so at their own risk entirely and no liability is accepted by WaveTrack in respect thereof. © All rights are copyrights to WaveTrack. Reproduction and / or dissemination without WaveTrack's prior consent is strictly forbidden. We encourage reviews, quotation and reference but request that full credit is given.
Editors’ Picks

AUD/USD extends the bounce, focus back to 0.7100
AUD/USD adds to Monday’s optimism and approaches the key 0.7100 barrier ahead of the opening bell in Asia. The pair’s positive performance comes as investors keep assessing the hawkish tilt from the RBA Minutes and despite humble gains in the Greenback. Next in Oz will be the Westpac Leading Index and the Wage Price Index.

EUR/USD meets initial support around 1.1800
EUR/USD remains on the back foot, although it has managed to reverse the initial strong pullback toward the 1.1800 region and regain some balance, hovering around the 1.1850 zone as the NA session draws to a close on Tuesday. Moving forward, market participants will now shift their attention to the release of the FOMC Minutes and US hard data on Wednesday.

Gold remains offered below $5,000
Gold stays on the defensive on Tuesday, receding to the sub-$5,000 region per troy ounce on the back of the persistent move higher in the Greenback. The precious metal’s decline is also underpinned by the modest uptick in US Treasury yields across the spectrum.

Ethereum Price Forecast: BitMine extends ETH buying streak, says long-term outlook remains positive
Ethereum (ETH) treasury firm BitMine Immersion continued its weekly purchase of the top altcoin last week after acquiring 45,759 ETH.

UK jobs market weakens, bolstering rate cut hopes
In the UK, the latest jobs report made for difficult reading. Nonetheless, this represents yet another reminder for the Bank of England that they need to act swiftly given the collapse in inflation expected over the coming months.
RECOMMENDED LESSONS
Making money in forex is easy if you know how the bankers trade!
I’m often mystified in my educational forex articles why so many traders struggle to make consistent money out of forex trading. The answer has more to do with what they don’t know than what they do know. After working in investment banks for 20 years many of which were as a Chief trader its second knowledge how to extract cash out of the market.
5 Forex News Events You Need To Know
In the fast moving world of currency markets where huge moves can seemingly come from nowhere, it is extremely important for new traders to learn about the various economic indicators and forex news events and releases that shape the markets. Indeed, quickly getting a handle on which data to look out for, what it means, and how to trade it can see new traders quickly become far more profitable and sets up the road to long term success.
Top 10 Chart Patterns Every Trader Should Know
Chart patterns are one of the most effective trading tools for a trader. They are pure price-action, and form on the basis of underlying buying and selling pressure. Chart patterns have a proven track-record, and traders use them to identify continuation or reversal signals, to open positions and identify price targets.
7 Ways to Avoid Forex Scams
The forex industry is recently seeing more and more scams. Here are 7 ways to avoid losing your money in such scams: Forex scams are becoming frequent. Michael Greenberg reports on luxurious expenses, including a submarine bought from the money taken from forex traders. Here’s another report of a forex fraud. So, how can we avoid falling in such forex scams?
What Are the 10 Fatal Mistakes Traders Make
Trading is exciting. Trading is hard. Trading is extremely hard. Some say that it takes more than 10,000 hours to master. Others believe that trading is the way to quick riches. They might be both wrong. What is important to know that no matter how experienced you are, mistakes will be part of the trading process.
The challenge: Timing the market and trader psychology
Successful trading often comes down to timing – entering and exiting trades at the right moments. Yet timing the market is notoriously difficult, largely because human psychology can derail even the best plans. Two powerful emotions in particular – fear and greed – tend to drive trading decisions off course.

