![]() Rick Wright
Rick Wright
Online Trading Academy
Hello traders! In this week’s newsletter we’ll talk a little about the psychological theory of cognitive dissonance, and how I perceive that it applies to trading. Plus, moving averages!
This past week I had the great opportunity to teach our three-day Market Timing Orientation class in a large town in North Dakota. One of the students had been trading for quite a while, but with limited success. She insisted that classical technical analysis works. In fact, even though she wasn’t making any money trading and had lost what would be the equivalent of a nice house, because it worked ‘sometimes,’ she felt with just a tweak or two she could make money like the market gods certainly wanted her too.
Now, cognitive dissonance is a theory in psychology defined by Wikipedia as ‘the mental discomfort (psychological stress) experienced by a person who simultaneously holds two or more contradictory beliefs, ideas, or values. This discomfort is triggered by a situation in which a belief of a person clashes with new evidence perceived by that person. When confronted with facts that contradict personal beliefs, ideals, and values, people will find a way to resolve the contradiction in order to reduce their discomfort.’
In our world of trading, and especially in our orientation classes, I meet people frequently who experience this. Here’s how it worked in this example: classic technical analysis works; I am not profitable using it. Therefore, I must be using it wrong.
During this class, we shared numerous examples of how classical technical analysis is either very late for entries and exits, or completely wrong about market direction. This particular student loved moving averages. Not those ridiculous, slow moving averages like the 50 and 200 mind you, but much faster, smaller, nimble moving averages like the 9 and 20 period. As many of you know from previous newsletters, the larger the number, the slower/smoother/further lagging the moving average is. Using a crossover of the faster moving average through the slower moving average generates buy and sell signals in this student’s technique. Here are a few examples of how late and wrong they can be:
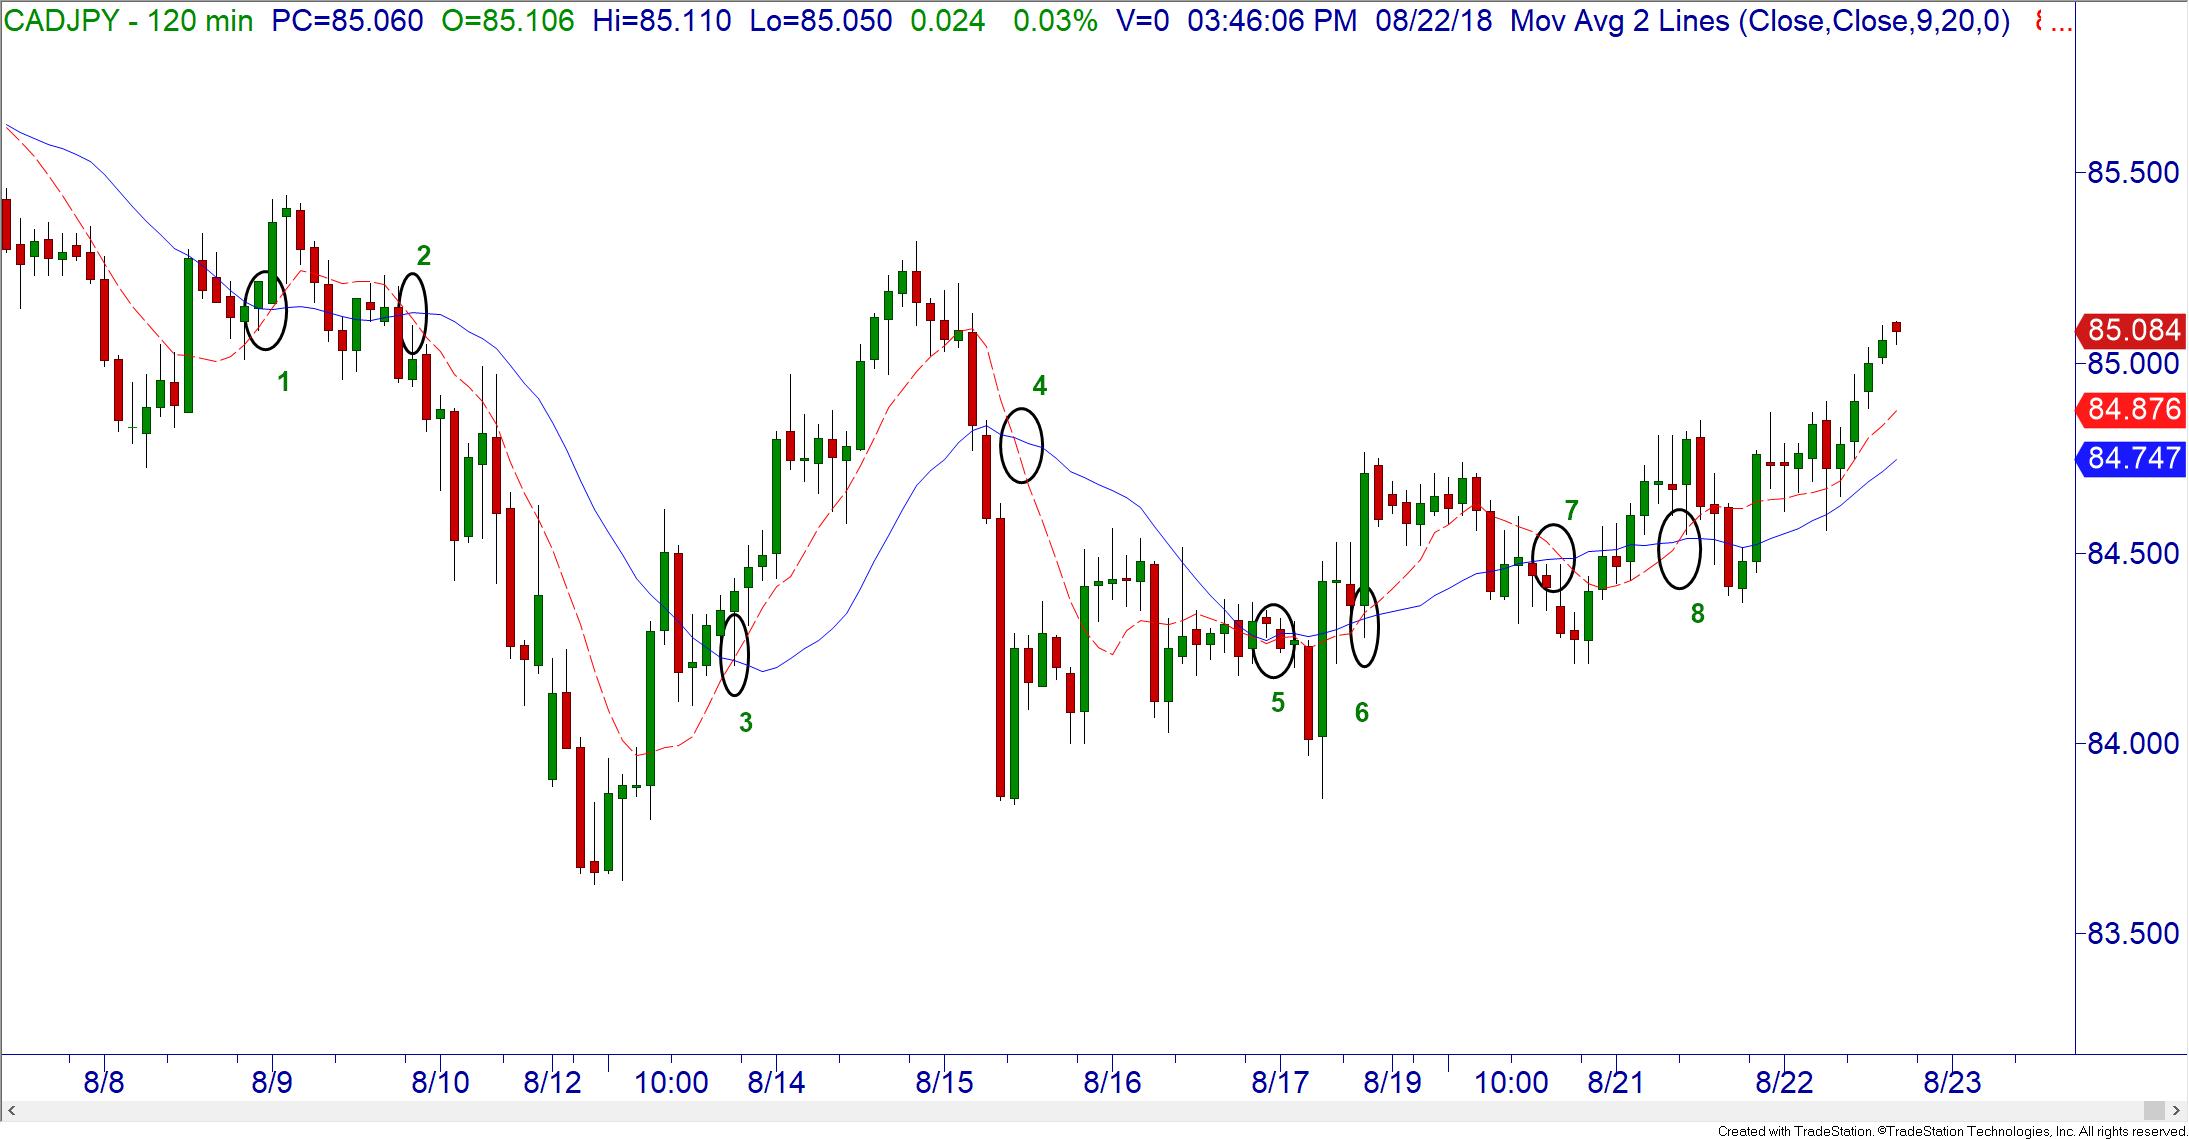
The most important thing I can say about this chart is LOOK AT WHERE PRICE IS WHEN THE SIGNAL SHOWS UP.
| Oval number | Signal | Problem | Probable trade outcome |
| 1 | buy | Upward move is almost over | Loss |
| 2 | sell | Missed start of move by 40 pips | If held long enough, winner |
| 3 | buy | Missed start of move by 60 pips | If held long enough winner |
| 4 | sell | Signal came after move was over | Loss |
| 5 | sell | No move to speak of | Loss |
| 6 | buy | Signal came after move was over | Loss |
| 7 | sell | Move almost over when signal came | Loss |
| 8 | buy | Bought at top of move | Stop probably hit, loss |
So lets take a look at what using supply and demand trades could have looked like on this chart:
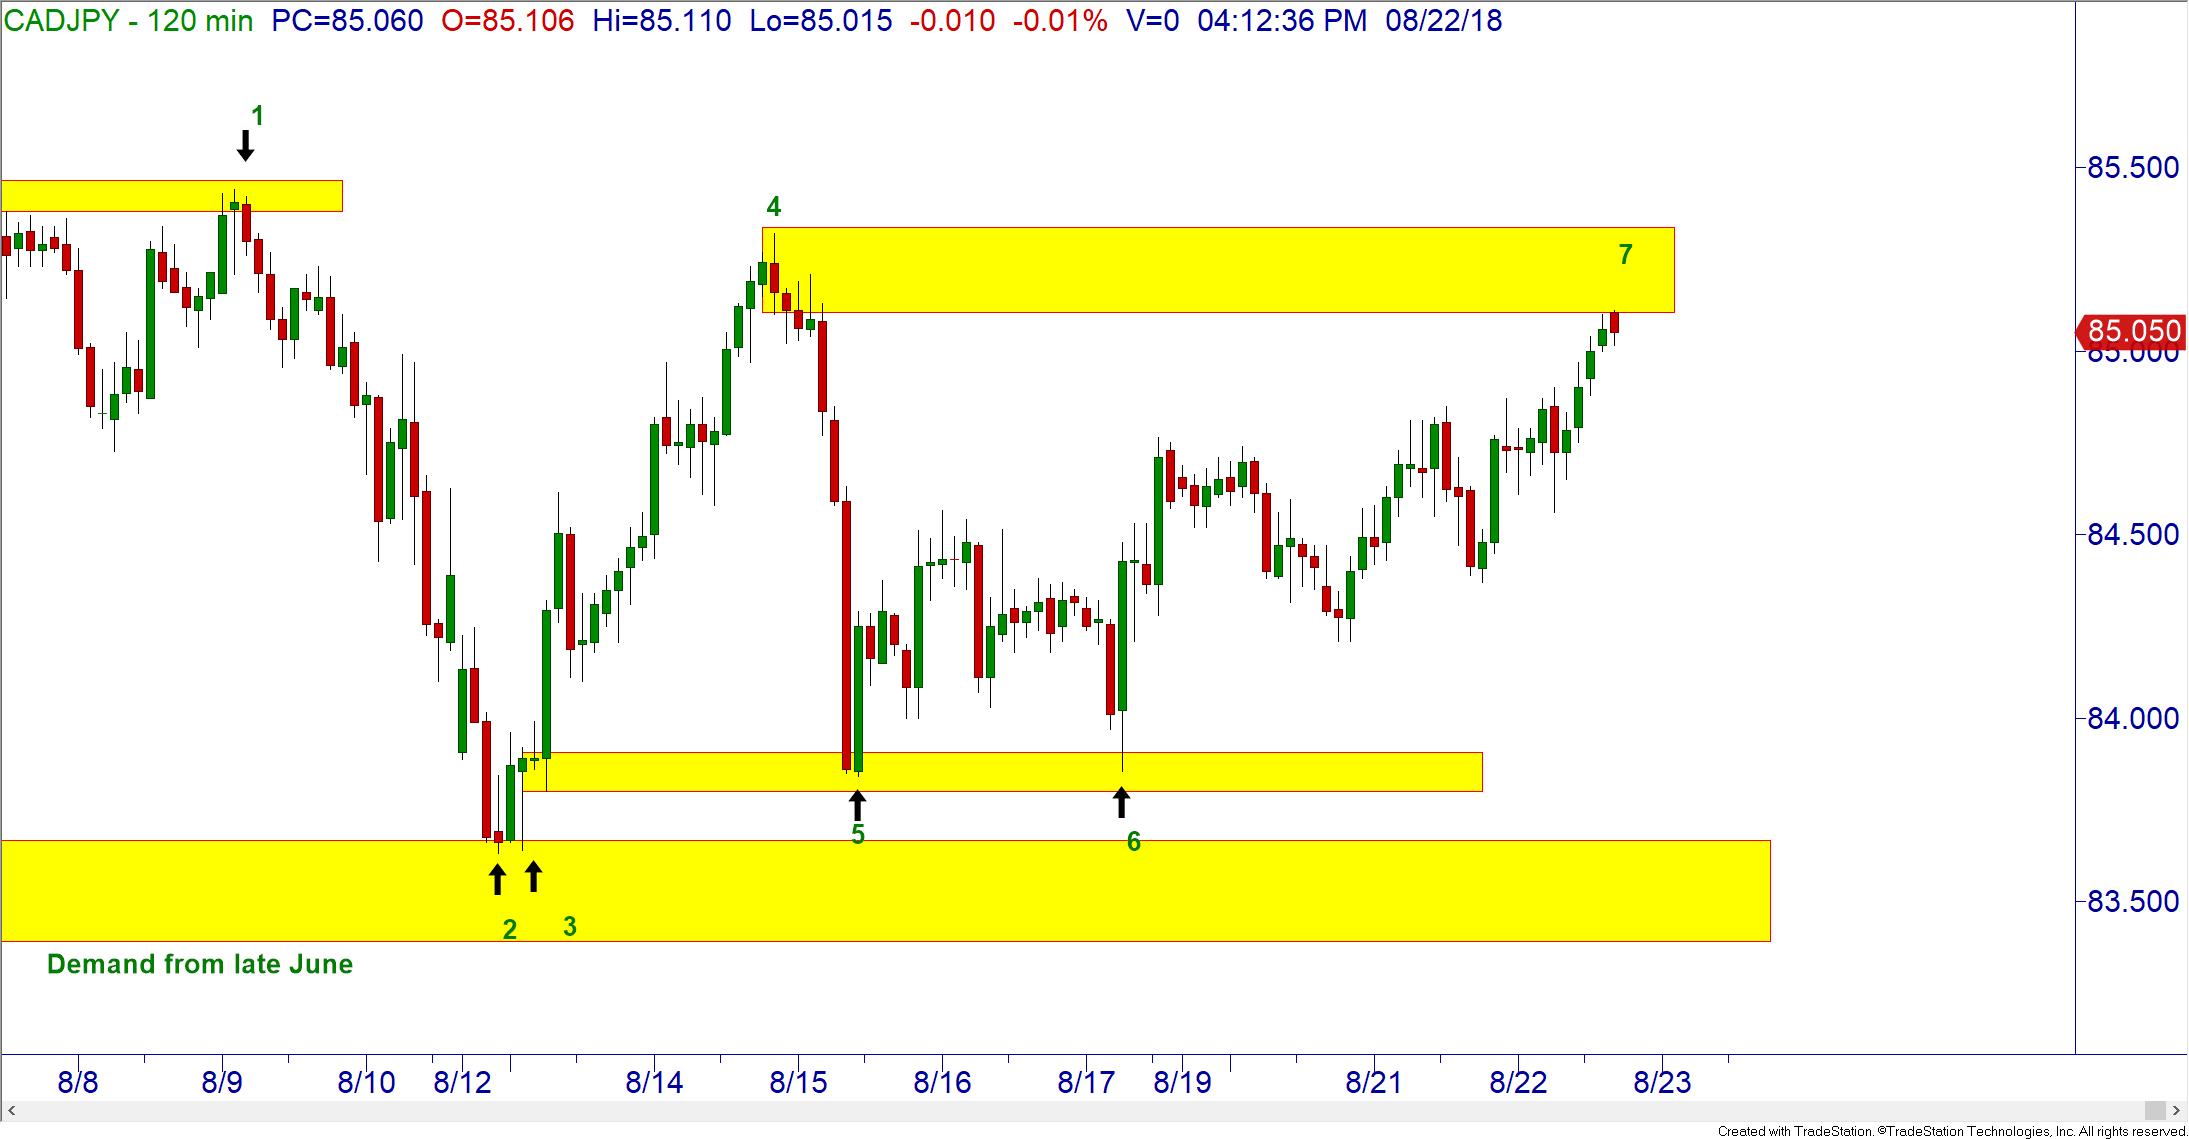
| Arrow number | Signal | Probable outcome |
| 1 | sell | Large winner |
| 2 | buy | Flat |
| 3 | buy | Winner |
| 4 | sell | Winner |
| 5 | buy | Small winner |
| 6 | buy | Winner |
| 7 | sell | To be determined! |
Before you OTA students pepper me with emails about all the zones I missed, I tried to make this as clean and easy to explain as possible! There were 3 entries between arrow 1 and 2, 3 more between 3 and 4, and another 3 between 6 and 7. Plus a couple more….
Back to the Market Timing Student. During every three-day class we show a few examples of how our core strategy works in action, via a short Extended Learning Track recording. (Extended Learning Track is our online classroom where you watch instructors trade in front of you.) In EVERY instance of an instructor using pure supply and demand for entries, this student would ask ‘which moving average were they using?’ or ‘what Fibonacci retracement was that?’ or ‘was the stochastics overbought or oversold? You get the idea. By being SHOWN profitable trades WITHOUT using what she believed were necessary analytics, she was having trouble accepting what was in front of her eyes.
As has been said hundreds of times before in our newsletters, trading is SIMPLE, but not EASY. Very often you will have to throw out some things that you thought were true to become a successful trader. This is why we often also say that charts are the easy part, between your ears is the hard part.
Read the original article here - Do You Question What You See?
This content is intended to provide educational information only. This information should not be construed as individual or customized legal, tax, financial or investment services. As each individual's situation is unique, a qualified professional should be consulted before making legal, tax, financial and investment decisions. The educational information provided in this article does not comprise any course or a part of any course that may be used as an educational credit for any certification purpose and will not prepare any User to be accredited for any licenses in any industry and will not prepare any User to get a job. Reproduced by permission from OTAcademy.com click here for Terms of Use: https://www.otacademy.com/about/terms
Editors’ Picks

EUR/USD flat lines below 1.1900; divergent Fed-ECB expectations offer support
The EUR/USD pair struggles to capitalize on the overnight bounce from the 1.1835-1.1830 region and oscillates in a narrow band during the Asian session on Thursday. Spot prices currently trade around the 1.1875 area, remaining nearly unchanged for the day and staying within striking distance of an over one-week high, reached on Tuesday, amid mixed cues.

GBP/USD slips heading into the Thursday trading window
The Pound Sterling pulled back from four-year highs on Wednesday, weighed down by a combination of Bank of England dovishness and UK political uncertainty, even as the US Dollar weakened on soft labor market revisions.

USD/JPY strengthens above 153.00 despite stronger US jobs data
The USD/JPY pair attracts some sellers to around 153.20 during the early Asian session on Thursday. The Japanese Yen strengthens against the US Dollar in the aftermath of Prime Minister Sanae Takaichi's landslide election victory. The attention will shift to the US Consumer Price Index inflation report, which is due later on Friday.
Editors’ Picks

AUD/USD bulls pause amid post-NFP USD rebound
AUD/USD is trading with a mild negative bias during the Asian session on Thursday, below a three-year high set the previous day. The US Dollar looks to build on Wednesday's upbeat US NFP-inspired bounce from an over one-week low, acting as a headwind for spot prices. However, the divergent Fed-RBA expectations, along with the underlying bullish sentiment, should help limit any meaningful corrective fall for the risk-sensitive Aussie.
USD/JPY strengthens above 153.00 despite stronger US jobs data
The USD/JPY pair attracts some sellers to around 153.20 during the early Asian session on Thursday. The Japanese Yen strengthens against the US Dollar in the aftermath of Prime Minister Sanae Takaichi's landslide election victory. The attention will shift to the US Consumer Price Index inflation report, which is due later on Friday.

Gold posts modest gains above $5,050 as US-Iran tensions persist despite strong labor data
Gold price trades in positive territory near $5,060 during the early Asian session on Thursday. The precious metal edges higher despite stronger-than-expected US employment data. The release of the US Consumer Price Index inflation report will take center stage later on Friday.

Bitcoin holds steady despite strong US labour market
Bitcoin briefly bounced from $66,000 to above $68,000 but slightly reversed those gains following Wednesday's US January jobs report. The top crypto is hovering around $67,000, down 2% over the past 24 hours as of writing on Wednesday.

The market trades the path not the past
The payroll number did not just beat. It reset the tone. 130,000 vs. 65,000 expected, with a 35,000 whisper. 79 of 80 economists leaning the wrong way. Unemployment and underemployment are edging lower. For all the statistical fog around birth-death adjustments and seasonal quirks, the core message was unmistakable. The labour market is not cracking.
RECOMMENDED LESSONS
Making money in forex is easy if you know how the bankers trade!
I’m often mystified in my educational forex articles why so many traders struggle to make consistent money out of forex trading. The answer has more to do with what they don’t know than what they do know. After working in investment banks for 20 years many of which were as a Chief trader its second knowledge how to extract cash out of the market.
5 Forex News Events You Need To Know
In the fast moving world of currency markets where huge moves can seemingly come from nowhere, it is extremely important for new traders to learn about the various economic indicators and forex news events and releases that shape the markets. Indeed, quickly getting a handle on which data to look out for, what it means, and how to trade it can see new traders quickly become far more profitable and sets up the road to long term success.
Top 10 Chart Patterns Every Trader Should Know
Chart patterns are one of the most effective trading tools for a trader. They are pure price-action, and form on the basis of underlying buying and selling pressure. Chart patterns have a proven track-record, and traders use them to identify continuation or reversal signals, to open positions and identify price targets.
7 Ways to Avoid Forex Scams
The forex industry is recently seeing more and more scams. Here are 7 ways to avoid losing your money in such scams: Forex scams are becoming frequent. Michael Greenberg reports on luxurious expenses, including a submarine bought from the money taken from forex traders. Here’s another report of a forex fraud. So, how can we avoid falling in such forex scams?
What Are the 10 Fatal Mistakes Traders Make
Trading is exciting. Trading is hard. Trading is extremely hard. Some say that it takes more than 10,000 hours to master. Others believe that trading is the way to quick riches. They might be both wrong. What is important to know that no matter how experienced you are, mistakes will be part of the trading process.
The challenge: Timing the market and trader psychology
Successful trading often comes down to timing – entering and exiting trades at the right moments. Yet timing the market is notoriously difficult, largely because human psychology can derail even the best plans. Two powerful emotions in particular – fear and greed – tend to drive trading decisions off course.