Hello traders! One of the more interesting and helpful tools we have as traders is to use the correlation of the dollar index ($DXY) with our US dollar currency pairs. However, since non USD currencies don’t have their own index, we’ll have to make one. Let’s dive in!

First of all, the dollar index is basically showing the strength or weakness of the US dollar vs. a basket of currencies. Kind of like the S&P 500 is used to measure the direction (strength or weakness) of the average stock, we can use the dollar index in the same way for US dollar currency pair trades. Currently, the dollar index is vs. the basket of: EUR, JPY, GBP, CAD, SEK, and the CHF. The weighting will vary slightly over time, but right now the EUR is approximately 57%, the Yen about 14%, and the Pound about 10%.  Here is how it looks on a chart:

Chart

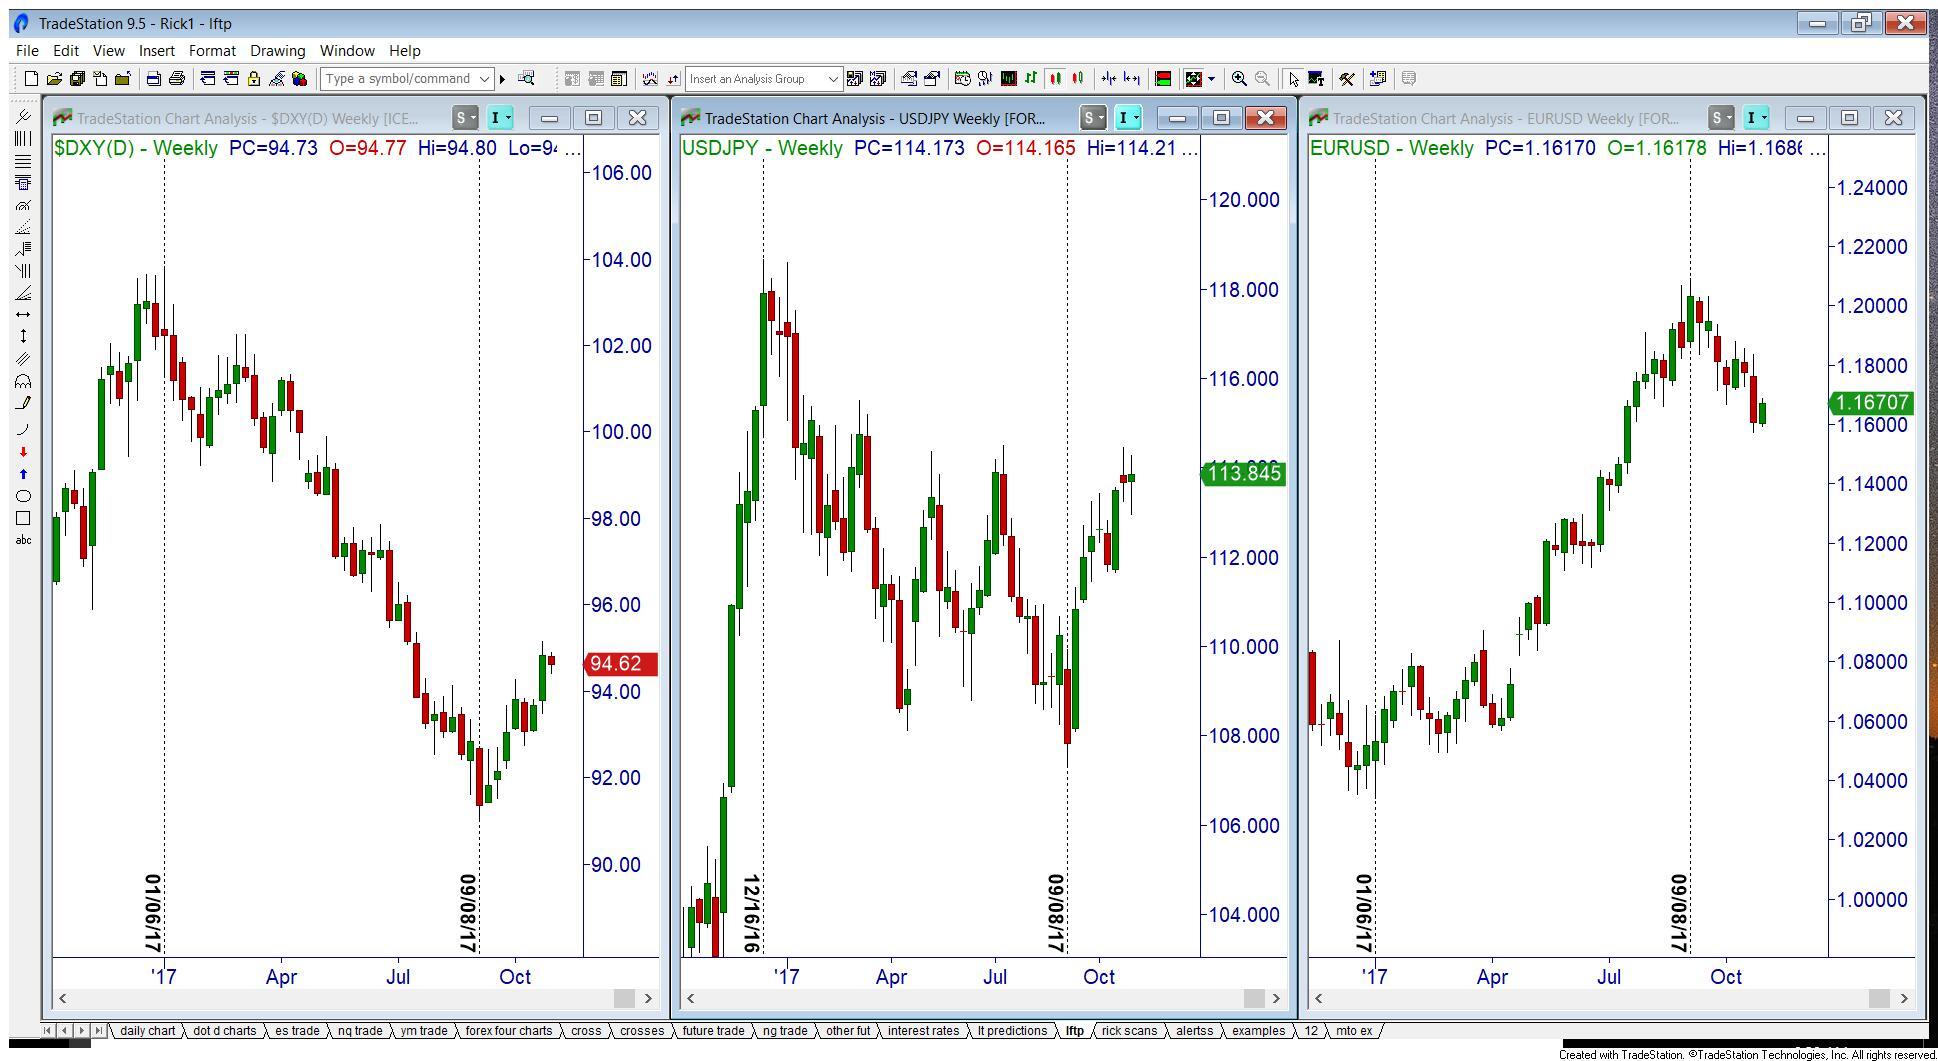
On this chart, I’ve marked in the high point on the dollar index going back to the beginning of the year, as well as the low so far this year. Notice how the USDJPY peaked within a few candles of the $DXY peak, and bottomed out in the exact same week. Because the USD is the base in the USDJPY currency pair, we expect the chart of the USDJPY and the $DXY to correlate pretty closely – a direct correlation. Now take a look at the EURUSD pair. The EURUSD bottomed out when the $DXY peaked, and the EURUSD peaked when the $DXY bottomed out. This is an inverse correlation, meaning it does the opposite.

For the sake of clarity on this chart, I did not mark in the supply and demand zones along the way to help us enter our trades, but the basic rules are as follows:

  • If USD is the BASE currency, look to buy when both $DXY and currency pair is in demand.

  • If USD is the QUOTE currency, look to buy the currency pair when it is in demand and the $DXY is in supply; look to sell the currency pair when it is in supply and the $DXY is in demand.

So, now that we know how to use the $DXY for USD pairs, what happens if we are trading something WITHOUT the USD in it? Like the EURJPY?

That is when making your “own” index can be helpful. Now, I’m talking about doing a bunch of math and software programming type stuff. All I’m talking about is comparing several currency pairs, with one currency being the same to deduce the strength or weakness of that one currency. The easiest example is the JPY, because it is always the quote currency. When doing this with something like the GBP, AUD, CAD, etc., you will have to understand the base vs. quote charts and what direction is strength vs. weakness.

EURJPY

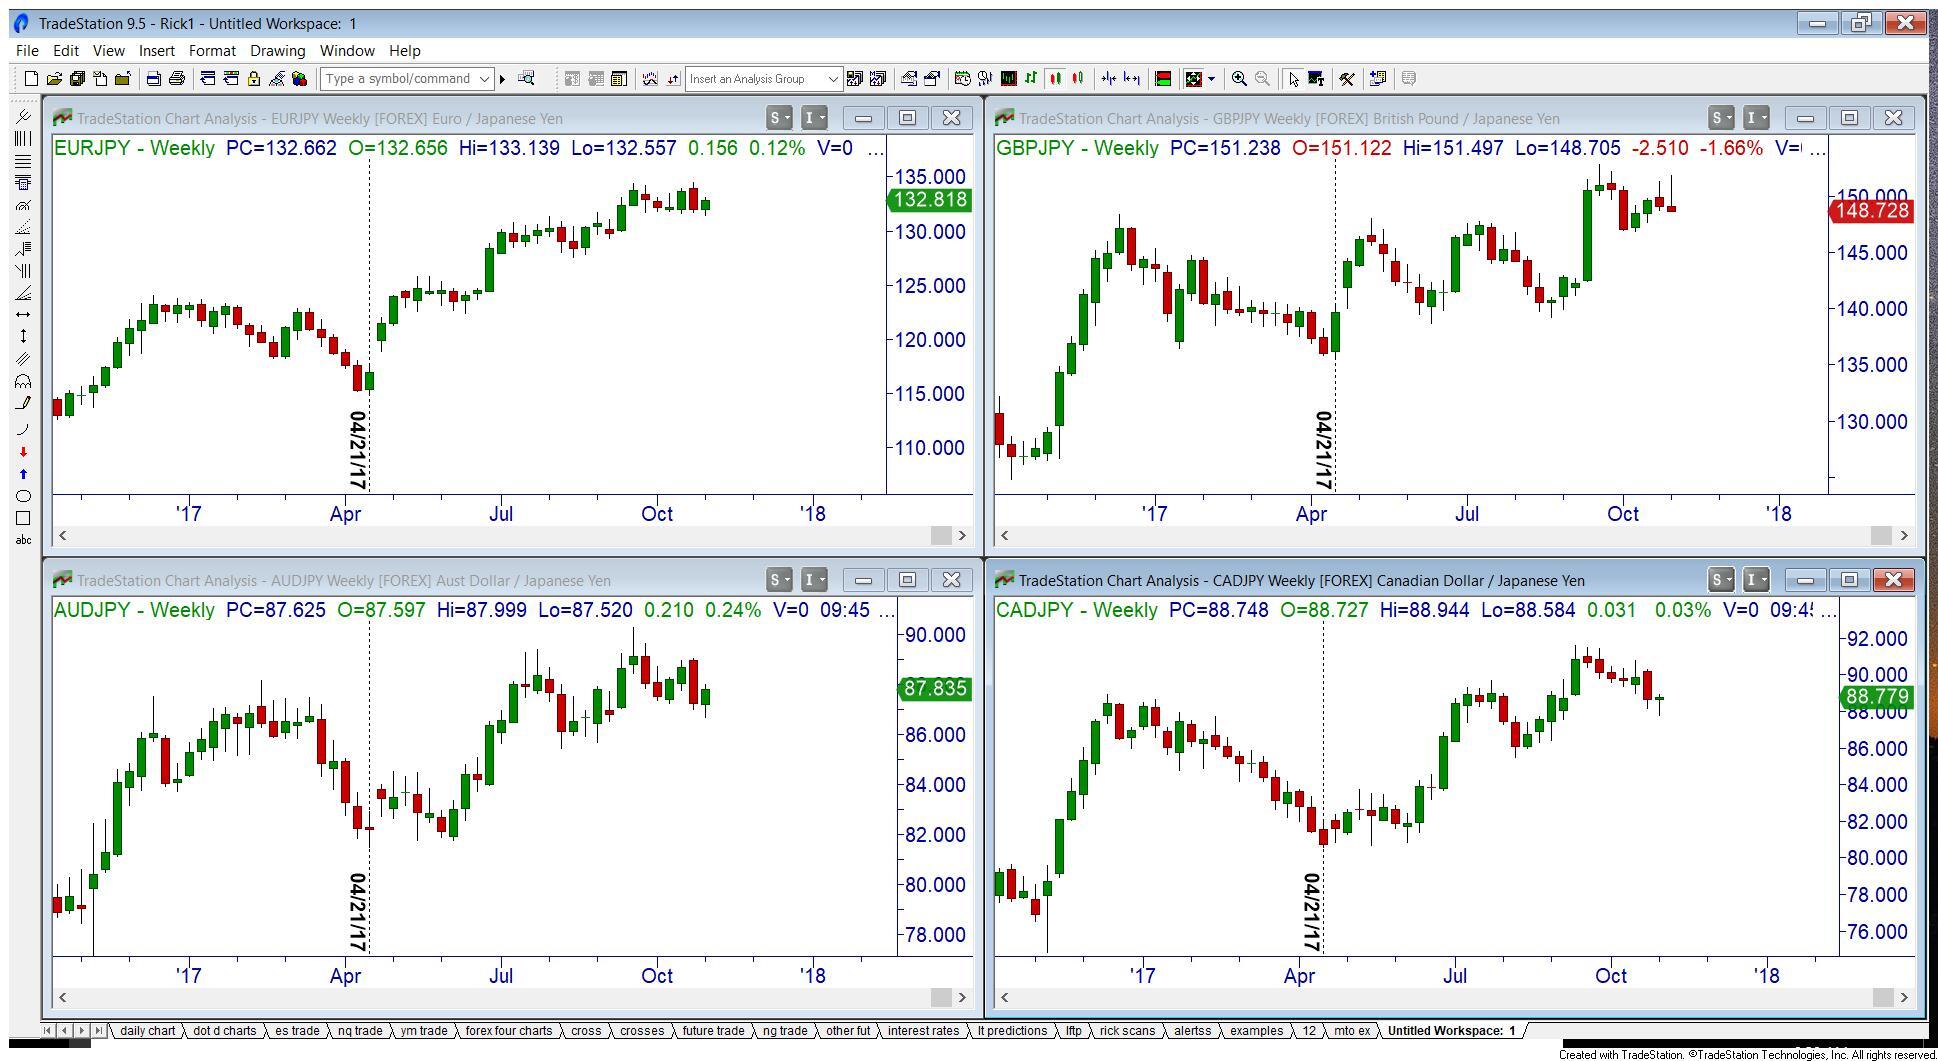
On this screenshot, I’ve inserted four different currency pairs, all with the JPY as the quote. Again, for clarity’s sake, I’ve only marked in the major low on each chart for 2017. As you can see, all four bottomed out in the same week! Please also notice how the major swing highs and lows have very strong correlations. This should be a big clue to us as traders that if all four pairs are in a demand zone, it might be a good time to look to buy; and if all four currency pairs are in supply, it might be a good time to look for a sell.

Before I wrap up this week’s newsletter, I must make an extremely important point. Notice above, all I said was “buy” and “sell”, not “long” or “short”!! That is because, in my humble opinion and in Online Trading Academy’s core strategy, just because you are in a good demand zone DOES NOT mean you automatically go long! (Or short in a good supply zone.) We believe that the trend is just as important as any zone you see. The point is this: in an uptrend we look to go long in a good demand zone. In a downtrend we look to go short in a good supply zone. In an uptrend, supply is used for profit targets; in a downtrend, demand is used for profit targets.

Hope all of this helps! Until next time,

Learn to Trade Now


This content is intended to provide educational information only. This information should not be construed as individual or customized legal, tax, financial or investment services. As each individual's situation is unique, a qualified professional should be consulted before making legal, tax, financial and investment decisions. The educational information provided in this article does not comprise any course or a part of any course that may be used as an educational credit for any certification purpose and will not prepare any User to be accredited for any licenses in any industry and will not prepare any User to get a job. Reproduced by permission from OTAcademy.com click here for Terms of Use: https://www.otacademy.com/about/terms

Editors’ Picks

EUR/USD rebounds after falling toward 1.1700

EUR/USD rebounds after falling toward 1.1700

EUR/USD gains traction and trades above 1.1730 in the American session, looking to end the week virtually unchanged. The bullish opening in Wall Street makes it difficult for the US Dollar to preserve its recovery momentum and helps the pair rebound heading into the weekend.


GBP/USD steadies below 1.3400 as traders assess BoE policy outlook

GBP/USD steadies below 1.3400 as traders assess BoE policy outlook

Following Thursday's volatile session, GBP/USD moves sideways below 1.3400 on Friday. Investors reassess the Bank of England's policy oıtlook after the MPC decided to cut the interest rate by 25 bps by a slim margin. Meanwhile, the improving risk mood helps the pair hold its ground.

USD/JPY rallies to near 157.00 as Yen plunges after BoJ’s policy outcome

USD/JPY rallies to near 157.00 as Yen plunges after BoJ’s policy outcome

The USD/JPY is up 0.85% to near 156.90 during the European trading session. The pair surges as the Japanese Yen underperforms across the board, following the Bank of Japan monetary policy announcement. In the policy meeting, the BoJ raised interest rates by 25 bps to 0.75%, as expected, the highest level seen in three decades.


Editors’ Picks

EUR/USD rebounds after falling toward 1.1700

EUR/USD rebounds after falling toward 1.1700

EUR/USD gains traction and trades above 1.1730 in the American session, looking to end the week virtually unchanged. The bullish opening in Wall Street makes it difficult for the US Dollar to preserve its recovery momentum and helps the pair rebound heading into the weekend.


USD/JPY rallies to near 157.00 as Yen plunges after BoJ’s policy outcome

USD/JPY rallies to near 157.00 as Yen plunges after BoJ’s policy outcome

The USD/JPY is up 0.85% to near 156.90 during the European trading session. The pair surges as the Japanese Yen underperforms across the board, following the Bank of Japan monetary policy announcement. In the policy meeting, the BoJ raised interest rates by 25 bps to 0.75%, as expected, the highest level seen in three decades.

Gold stays below $4,350, looks to post small weekly gains

Gold stays below $4,350, looks to post small weekly gains

Gold struggles to gather recovery momentum and stays below $4,350 in the second half of the day on Friday, as the benchmark 10-year US Treasury bond yield edges higher. Nevertheless, the precious metal remains on track to end the week with modest gains as markets gear up for the holiday season.

Crypto Today: Bitcoin, Ethereum, XRP rebound amid bearish market conditions

Crypto Today: Bitcoin, Ethereum, XRP rebound amid bearish market conditions

Bitcoin (BTC) is edging higher, trading above $88,000 at the time of writing on Monday. Altcoins, including Ethereum (ETH) and Ripple (XRP), are following in BTC’s footsteps, experiencing relief rebounds following a volatile week.

How much can one month of soft inflation change the Fed’s mind?

How much can one month of soft inflation change the Fed’s mind?

One month of softer inflation data is rarely enough to shift Federal Reserve policy on its own, but in a market highly sensitive to every data point, even a single reading can reshape expectations. November’s inflation report offered a welcome sign of cooling price pressures. 

RECOMMENDED LESSONS

5 Forex News Events You Need To Know

In the fast moving world of currency markets where huge moves can seemingly come from nowhere, it is extremely important for new traders to learn about the various economic indicators and forex news events and releases that shape the markets. Indeed, quickly getting a handle on which data to look out for, what it means, and how to trade it can see new traders quickly become far more profitable and sets up the road to long term success.

Top 10 Chart Patterns Every Trader Should Know

Chart patterns are one of the most effective trading tools for a trader. They are pure price-action, and form on the basis of underlying buying and selling pressure. Chart patterns have a proven track-record, and traders use them to identify continuation or reversal signals, to open positions and identify price targets.

7 Ways to Avoid Forex Scams

The forex industry is recently seeing more and more scams. Here are 7 ways to avoid losing your money in such scams: Forex scams are becoming frequent. Michael Greenberg reports on luxurious expenses, including a submarine bought from the money taken from forex traders. Here’s another report of a forex fraud. So, how can we avoid falling in such forex scams?

What Are the 10 Fatal Mistakes Traders Make

Trading is exciting. Trading is hard. Trading is extremely hard. Some say that it takes more than 10,000 hours to master. Others believe that trading is the way to quick riches. They might be both wrong. What is important to know that no matter how experienced you are, mistakes will be part of the trading process.

Strategy

Money Management

Psychology

Best Brokers of 2025