Share:

People seem to think that since they hear that so few people are successful in trading, that there must be a complicated process to complete in order to make money.  The truth is, that the simpler we make trading, the more profitable it seems to be.  Many traders and investors often seek out complicated indicators, so this week I decided to discuss a simple technique that is often overlooked when traders are reading charts, specifically candle charts.  We are all too quick to look at the squiggly lines we call indicators and oscillators and dismiss the simplest signal available to us, PRICE!

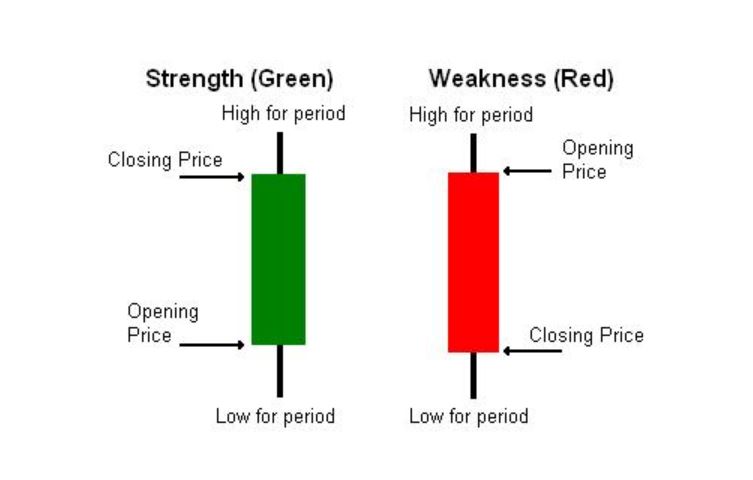
The most common way that price is displayed for most traders is through candle charts. If you are not familiar with the construction of a candlestick, I have included the quick reference below.  There are two parts to candles.  The body of the candle is the colored portion and indicates the opening price and the closing price of the candle.  The lines sticking out from the top and or bottom of the candle’s body are known interchangeably as tails, shadows, or wicks.

A green candle usually indicates strength in price and is formed due to price closing higher than it opened during that period.  The bottom of the body is the opening and top is the closing.  Conversely, the red candle indicates weakness due to the closing price being lower than the open for that period.  The top of the body of a red candle is the opening price and the bottom of the body is the closing.

Candle

The problem is that many traders end their candle analysis there.  You must look to see what the tails (wicks, shadows or whatever else you wish to call them) are telling you.  These tails mark the highs and lows of the period.  If I asked you what the candle below signifies, you may tell me weakness since it is red.

Candle

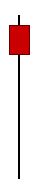
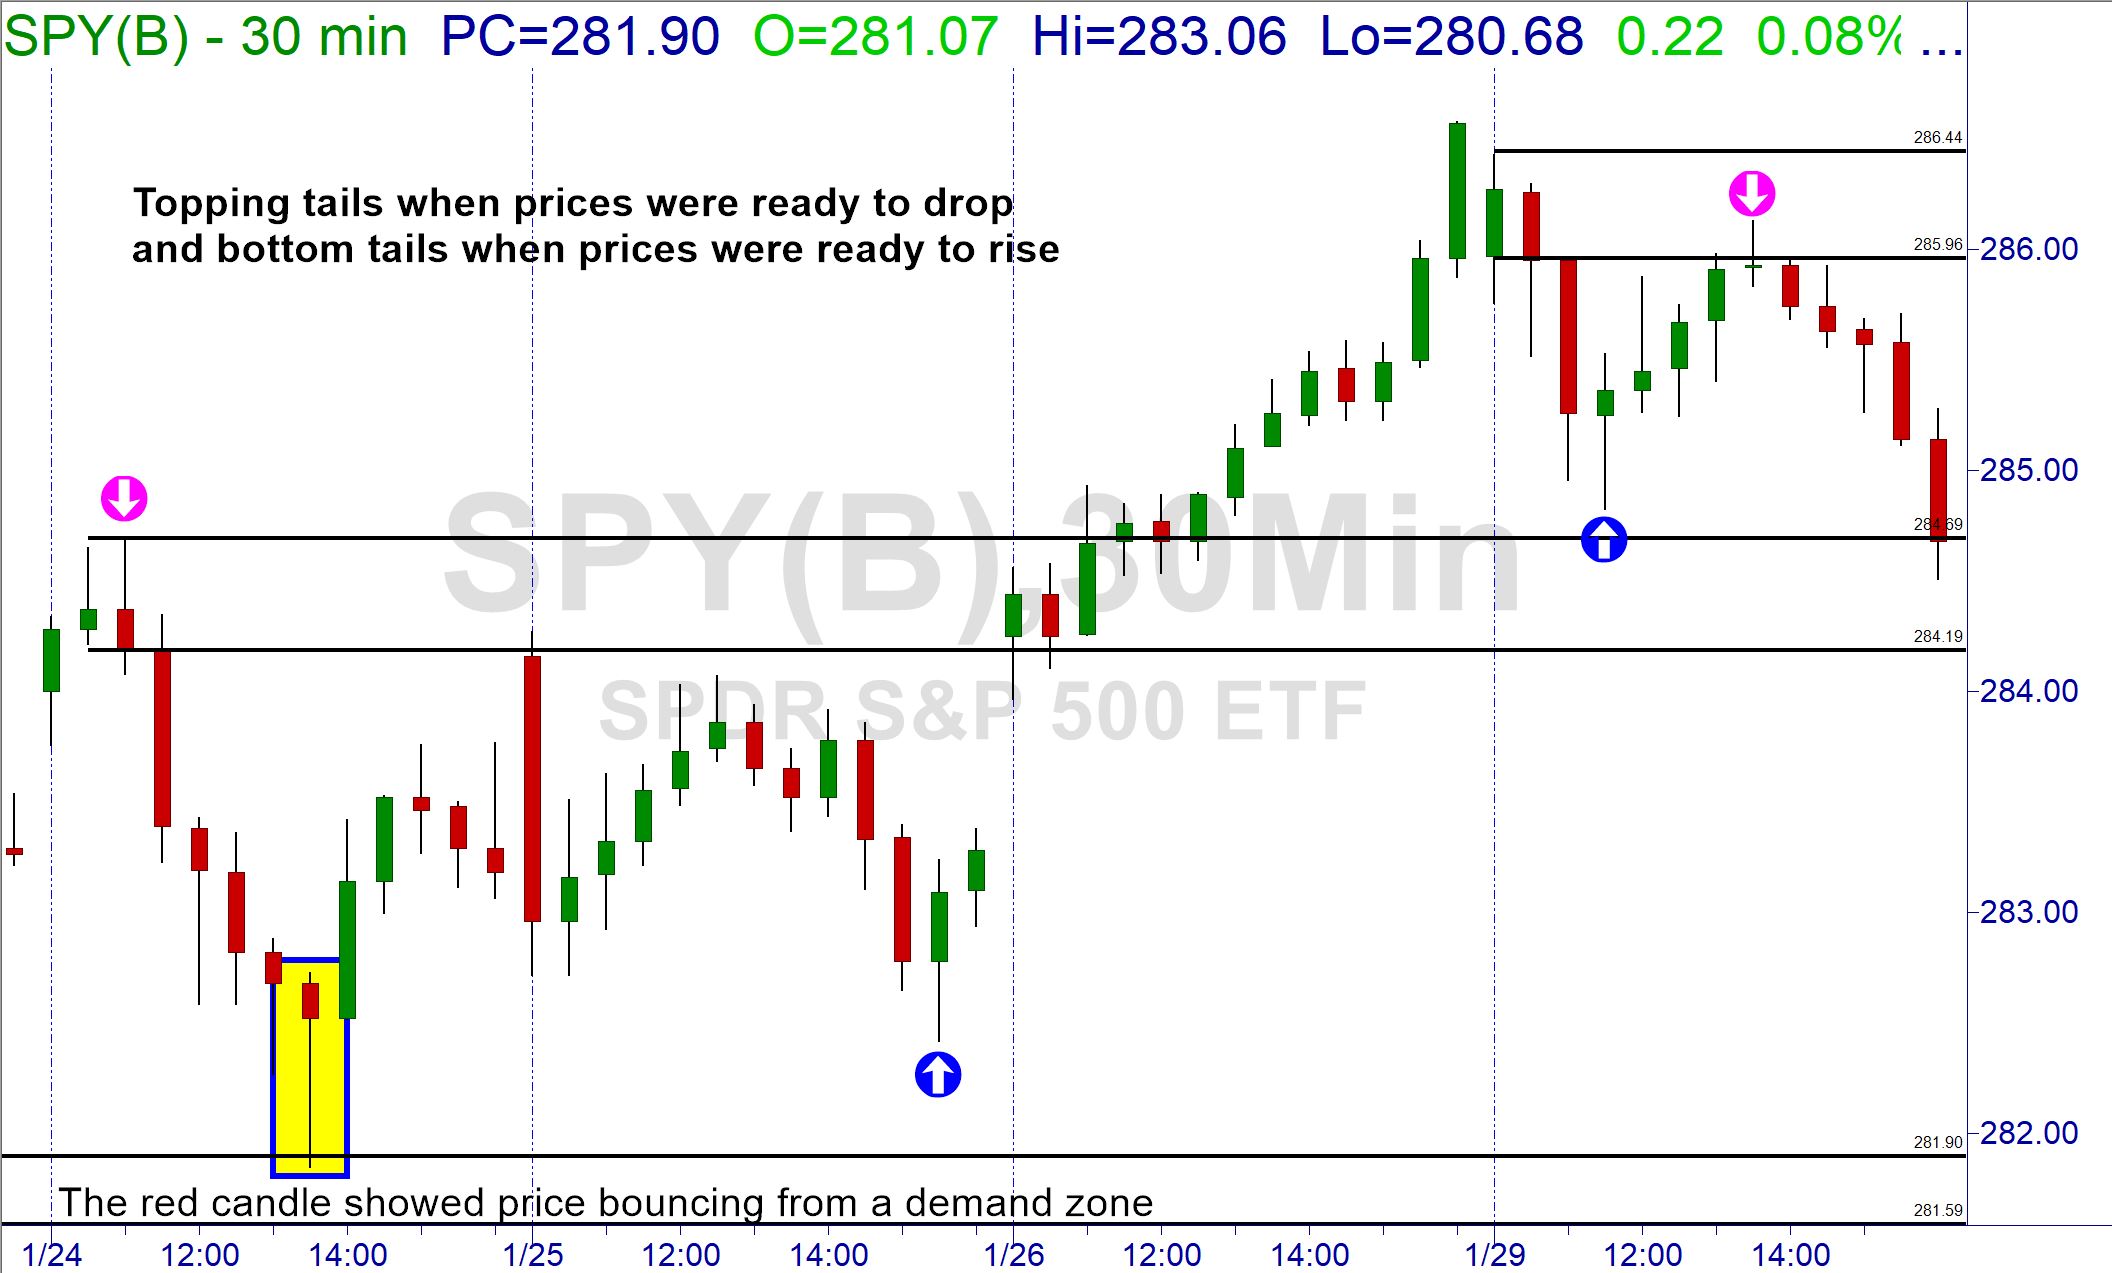
However, with further examination, you will see that there is a long tail to the downside.  This means, that even though the bears pushed the price lower, there was enough bullish pressure to move price higher before the close of that period.  This is a bullish candle!  Let’s look at the candle chart to see where it was in the whole trend.

Candle

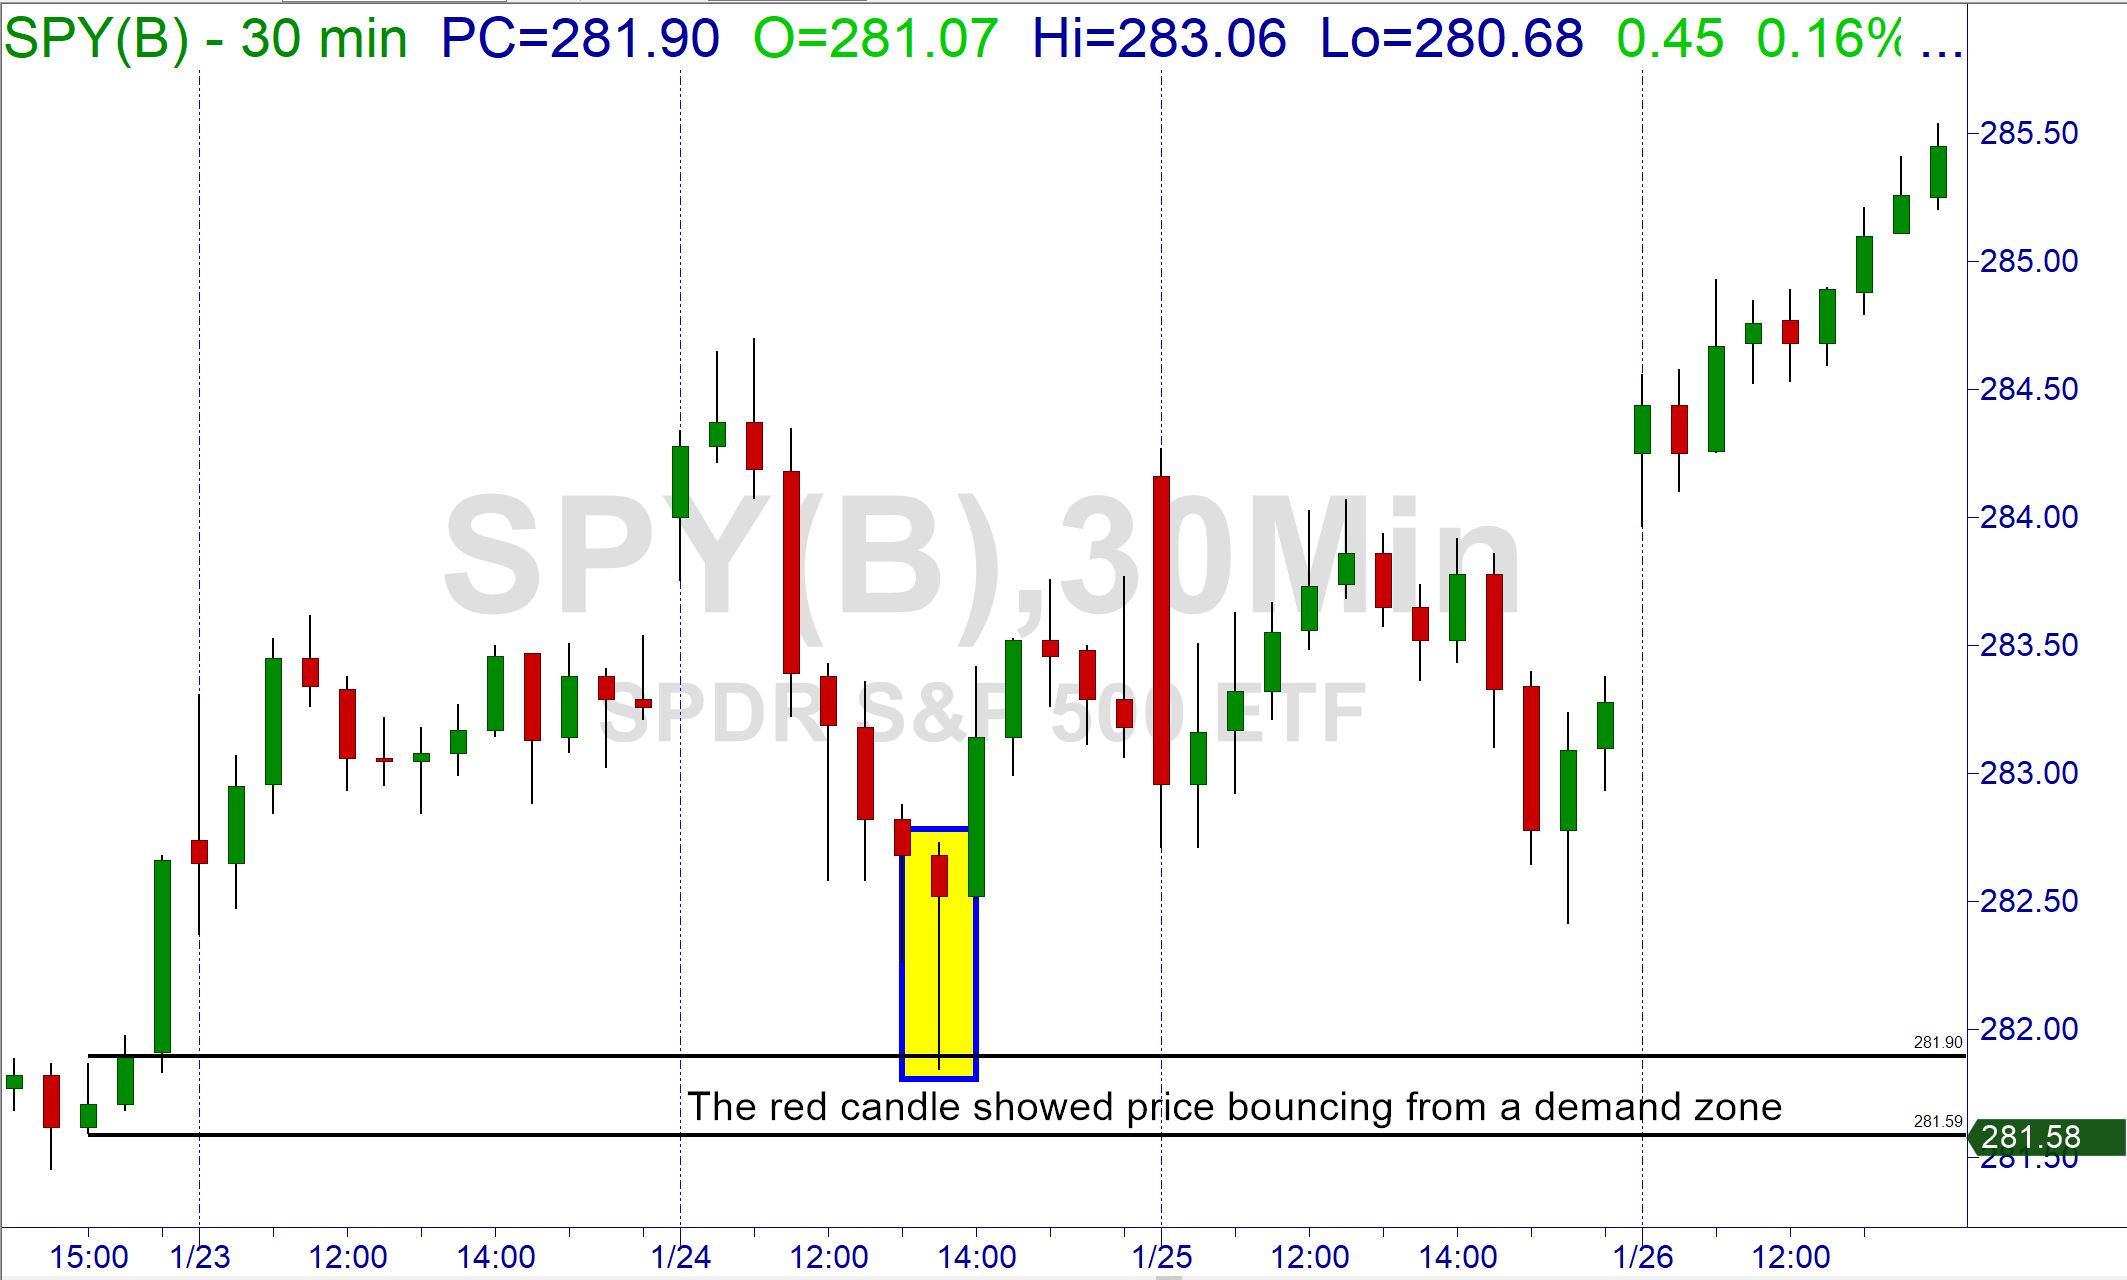
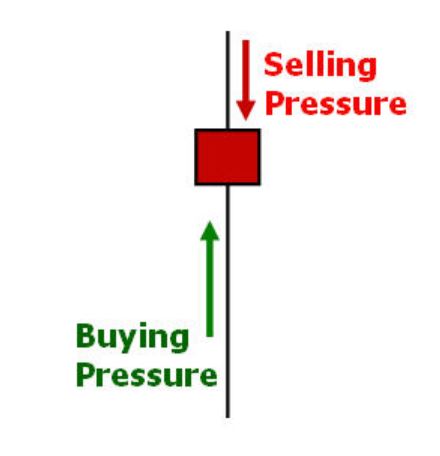
This red candle indicated that we were ready to bounce off demand with a lot of bullish pressure.  You must listen to the tale the tails are telling you.  Any candle tail that is above the real body (colored portion of candle) tells that the bulls were not able to hold price up and the bearish pressure moved prices downward.  Any tail below the body indicates buying pressure.

Candle

This becomes especially important when price is nearing a level of demand and/or supply.  By seeing which force is winning (bulls or bears) we can anticipate a bounce or break of that price level and take appropriate action.

SPY

Supply and demand are economic forces that determine price.  This is especially true when looking at the financial markets.  We can use the same tools for reading supply and demand as the professionals do.  We just must refer to the candle charts instead of incoming orders from clients.  Remember that price gives us clues as to the immediate direction the stock will go.  We just must be open to viewing it and listen to the tale of the tails!

This is one key factor for my trading success.  There are several others that we teach in the Professional Trader course.  Be sure to stop by your local Online Trading Academy office to see one of our many superstar traders/instructors for an educational experience you won’t ever forget!

Learn to Trade Now

Neither Freedom Management Partners nor any of its personnel are registered broker-dealers or investment advisers. I will mention that I consider certain securities or positions to be good candidates for the types of strategies we are discussing or illustrating. Because I consider the securities or positions appropriate to the discussion or for illustration purposes does not mean that I am telling you to trade the strategies or securities. Keep in mind that we are not providing you with recommendations or personalized advice about your trading activities. The information we are providing is not tailored to any individual. Any mention of a particular security is not a recommendation to buy, sell, or hold that or any other security or a suggestion that it is suitable for any specific person. Keep in mind that all trading involves a risk of loss, and this will always be the situation, regardless of whether we are discussing strategies that are intended to limit risk. Also, Freedom Management Partners’ personnel are not subject to trading restrictions. I and others at Freedom Management Partners could have a position in a security or initiate a position in a security at any time.

Editors’ Picks

EUR/USD hovers around 1.0700 after German IFO data

EUR/USD hovers around 1.0700 after German IFO data

EUR/USD stays in a consolidation phase at around 1.0700 in the European session on Wednesday. Upbeat IFO sentiment data from Germany helps the Euro hold its ground as market focus shifts to US Durable Goods Orders data.

EUR/USD News

GBP/USD steadies near 1.2450, awaits mid-tier US data

GBP/USD steadies near 1.2450, awaits mid-tier US data

GBP/USD is keeping its range at around 1.2450 in European trading on Wednesday. A broadly muted US Dollar combined with a risk-on market mood lend support to the pair, as traders await the mid-tier US Durable Goods data for further trading directives. 

GBP/USD News

USD/JPY refreshes 34-year high, attacks 155.00 as intervention risks loom

USD/JPY refreshes 34-year high, attacks 155.00 as intervention risks loom

USD/JPY is renewing a multi-decade high, closing in on 155.00. Traders turn cautious on heightened risks of Japan's FX intervention. Broad US Dollar rebound aids the upside in the major. US Durable Goods data are next on tap. 

USD/JPY News

Editors’ Picks

EUR/USD hovers around 1.0700 after German IFO data

EUR/USD hovers around 1.0700 after German IFO data

EUR/USD stays in a consolidation phase at around 1.0700 in the European session on Wednesday. Upbeat IFO sentiment data from Germany helps the Euro hold its ground as market focus shifts to US Durable Goods Orders data.

EUR/USD News

USD/JPY refreshes 34-year high, attacks 155.00 as intervention risks loom

USD/JPY refreshes 34-year high, attacks 155.00 as intervention risks loom

USD/JPY is renewing a multi-decade high, closing in on 155.00. Traders turn cautious on heightened risks of Japan's FX intervention. Broad US Dollar rebound aids the upside in the major. US Durable Goods data are next on tap. 

USD/JPY News

Gold price trades with mild negative bias, manages to hold above $2,300 ahead of US data

Gold price trades with mild negative bias, manages to hold above $2,300 ahead of US data

Gold price (XAU/USD) edges lower during the early European session on Wednesday, albeit manages to hold its neck above the $2,300 mark and over a two-week low touched the previous day.

Gold News

Worldcoin looks set for comeback despite Nvidia’s 22% crash Premium

Worldcoin looks set for comeback despite Nvidia’s 22% crash

Worldcoin price is in a better position than last week's and shows signs of a potential comeback. This development occurs amid the sharp decline in the valuation of the popular GPU manufacturer Nvidia.

Read more

Three fundamentals for the week: US GDP, BoJ and the Fed's favorite inflation gauge stand out Premium

Three fundamentals for the week: US GDP, BoJ and the Fed's favorite inflation gauge stand out

While it is hard to predict when geopolitical news erupts, the level of tension is lower – allowing for key data to have its say. This week's US figures are set to shape the Federal Reserve's decision next week – and the Bank of Japan may struggle to halt the Yen's deterioration. 

Read more

RECOMMENDED LESSONS

7 Ways to Avoid Forex Scams

The forex industry is recently seeing more and more scams. Here are 7 ways to avoid losing your money in such scams: Forex scams are becoming frequent. Michael Greenberg reports on luxurious expenses, including a submarine bought from the money taken from forex traders. Here’s another report of a forex fraud. So, how can we avoid falling in such forex scams?

What Are the 10 Fatal Mistakes Traders Make

Trading is exciting. Trading is hard. Trading is extremely hard. Some say that it takes more than 10,000 hours to master. Others believe that trading is the way to quick riches. They might be both wrong. What is important to know that no matter how experienced you are, mistakes will be part of the trading process.

Strategy

Money Management

Psychology