Buyers vs. Sellers and the Option Profit Loss Graph

The price of an option changes as the price of its underlying stock changes, but the relationship is not one to one. In fact, the ratio of an option price to its stock price continuously changes and can be calculated using option software.
Because the ratio of stock price to option price is not constant, option traders need a tool to project what an option’s price will be if the underlying stock price reaches its target (or reaches a stop-loss price). The Option Profit/Loss Graph is that tool. It shows how much profit or loss a particular option position would be expected to make at any given stock price. Here’s a description of how to set up an option profit/loss graph and use it from the perspective of an option buyer.
In the linked example, the investor was contemplating buying a Call option on SPY, the exchange-traded fund that tracks the S&P 500 index.
In that example SPY had closed the day at $332 per share, and the trader believed that it would go up further in the next few weeks (not a recommendation, just a for-instance).
He saw that there were call options at the $330 strike price that were to expire in fourteen days. Each call option represented the right to buy 100 shares of SPY at $330 at any time in following two weeks. The price of the options at that time was $3.00 per share, or $300 per option contract.
The trader needed to know, if he bought the calls at their $3.00 per share price, how much money he could make if SPY went up, by say $4.00 per share or some other amount.
The option buyer’s P/L graph looked like this:
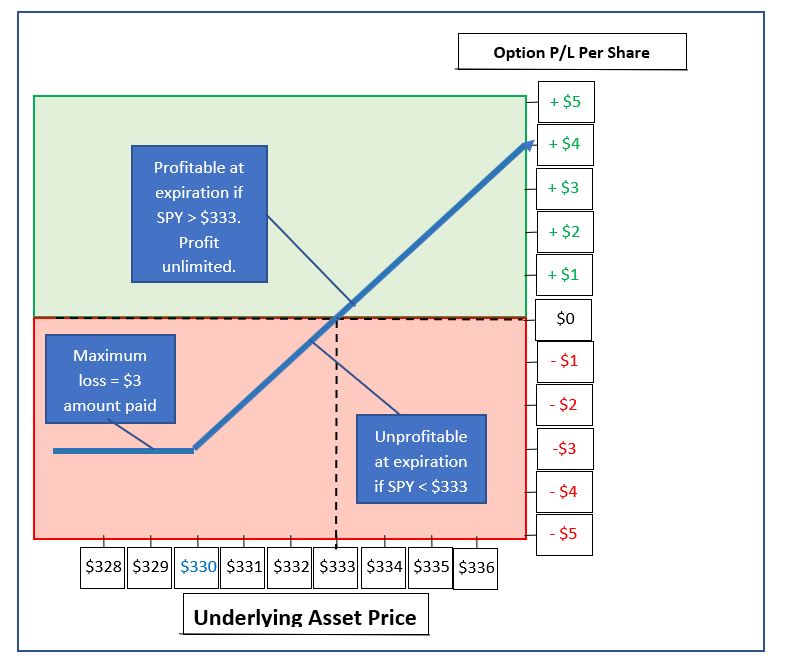
For the trader to make any money at all if he held the option until expiration, SPY would have to be at a price of at least $333.01 per share at that time. If it were, then the trader’s total investment of $333 per share ($3.00 for the option plus $330 for the stock) would be repaid. If SPY were to go up to a higher price, say $337, then the trader would have a profit of $337 – $333 or $4 per share on a $3 per share investment, all in 2 weeks.
Comparison of an Option Buy vs. Sell Position
If that trader (let’s call him Trader A) did rack up that $400 profit on his $300 investment, where would that $400 have come from?
The answer is that it would come indirectly from the person who sold the option to Trader A for $3.00.
Here’s how that would work. The option seller (let’s call him Trader B) sold the option for $300 because he did NOT believe that SPY would be above $330 per share when the option expired. If he were right, then there would be no reason for Trader A to exercise his option. Trader A would just let it go and chalk up a $300 loss. Trader B would keep the money, happily having made $300.
But what if Trader B were wrong and SPY did end up at $337?
Well, in exchange for the $300 in cash that he received when he sold the call, Trader B took on the obligation to deliver the SPY shares to Trader A, whenever Trader A ordered him to (if ever). In that event, Trader B agreed that he would accept $330 per share in payment. This movement of cash and shares would be handled by Trader A and Trader B’s respective brokers with no interaction between the traders themselves.
So, when Trader A decides to exercise his option, he phones his broker; who contacts the central option clearing house; who contacts Trader B’s Broker; who takes 100 shares of SPY out of Trader B’s account and delivers them to trader A. Trader A’s account is charged $330 per share ($33,000 in total), which is delivered to Trader B.
So, where does Trader B now stand? He originally collected $300 for selling the option. He just now collected another $33,000 from Trader A. He has received a total of $33,300 in cash from Trader A.
But wait – he just had to deliver 100 shares of SPY, which he did not have. His broker borrowed those shares on his behalf so that they could be delivered to Trader A. Trader B now owes those 100 shares of SPY to his broker. To acquire them, he must buy them in the open market at the current price, which is $337 per share, or $33,700 total.
In the end, Trader B took in $33,300 in cash, and paid out $33,700 in cash, for a net loss of $400 – the same $400 ($4.00 per share of SPY) that was Trader A’s profit.
Comparison of an Option Buy vs. Option Sell Profit/Loss Graph
What does Trader B’s profit graph look like?
Here it is:
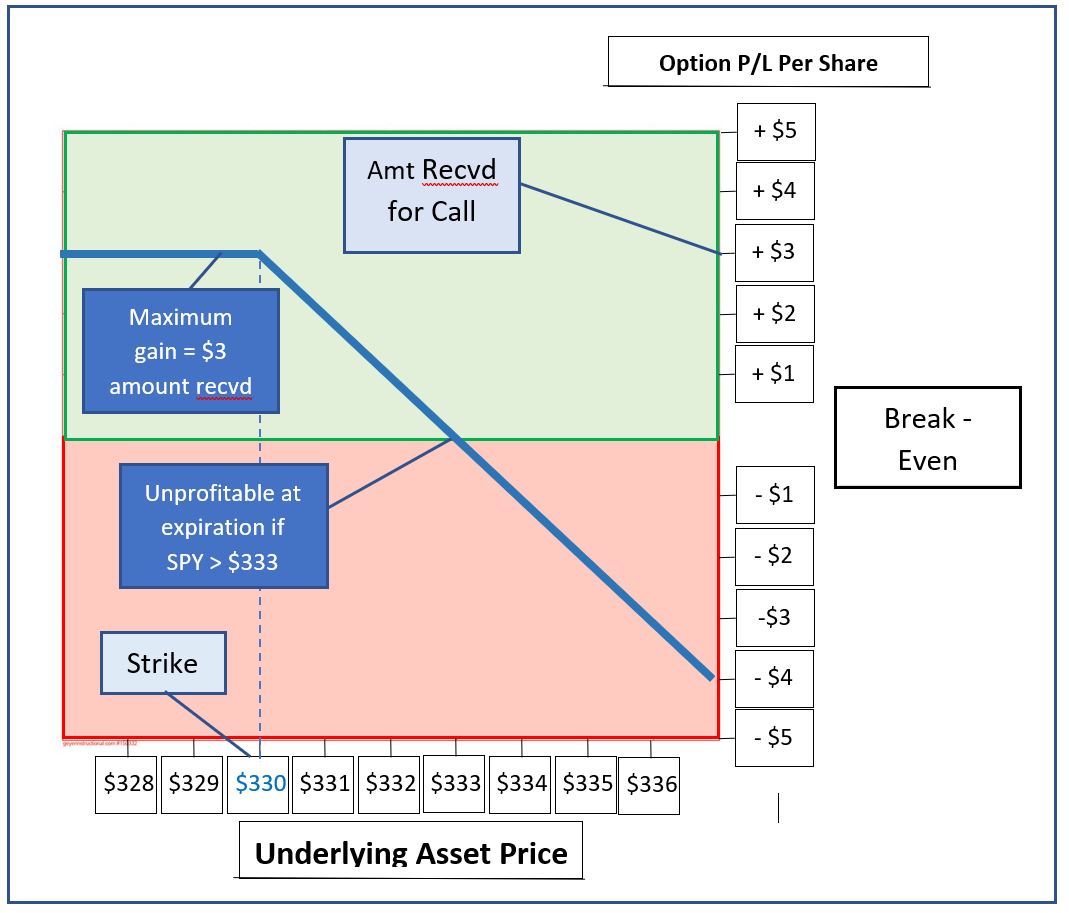
His graph shows that his SPY break-even price of $333 is the same as Trader A’s.
Trader B’s maximum profit is the $3 per share that he originally collected. Note that this same $300 is Trader A’s maximum loss.
Trader B has a loss of $4 per share if the Underlying Asset Price (SPY price) is at $337 at expiration. This is the same $4 per share that Trader A gained in that case.
And if SPY were higher than $337 at the option’s expiration, then Trader A would make even more money. All of that additional money would come out of Trader B’s pocket, with no limit.
If you look at both P/L graphs next to each other, you will see that Trader B’s situation is an exact mirror image of Trader A’s, with the graph rotated top to bottom around the break-even line. At any given Underlying Asset Price, one of the two makes a profit, and the other makes a loss of the same amount.
I hope this simple example has helped you to understand how useful the P/L Graph and its associated calculations are. The graph lets us visualize just what we can expect when the underlying asset price changes. With a little practice, reading these charts becomes second nature for option traders.
Author

Russ Allen
Online Trading Academy
Russ decided to make his lifelong passion, trading, his full-time occupation in 2003. With extensive experience in trading, education, and business in general, he sought the highest-quality trading education he could find.


