Bollinger Bands - Or Why They Are So Popular

Bollinger Bands are a very popular technical indicator that measures the price volatility of a financial instrument. This indicator is invented by the famous technical analyst John Bollinger in the 1980s, and trademarked by him in 2011. Bollinger Bands are showing the volatility of the price by plotting two bands, the upper and lower band, two standard deviations away from a simple moving average (SMA). In general, when the market becomes more volatile, the bands widen, and in less volatile period the bands become narrower. If the bands become narrower and track parallel for an extended time, the price will usually bounce of the upper and lower bands, which take a role of support and resistance lines in sideways trading conditions.
Bollinger Bands consist of three parts:
- The middle band, which is a N-period simple moving average. The standard setting is a 20-day SMA. Other moving averages, like the exponential moving average, is also used by some traders.
- The upper band, which is K standard deviations away from the moving average on the upside. The recommendation is K=2.
- The lower band, which is K standard deviations away from the moving average on the downside.
To make this concept clearer, take a look at the following graphic:
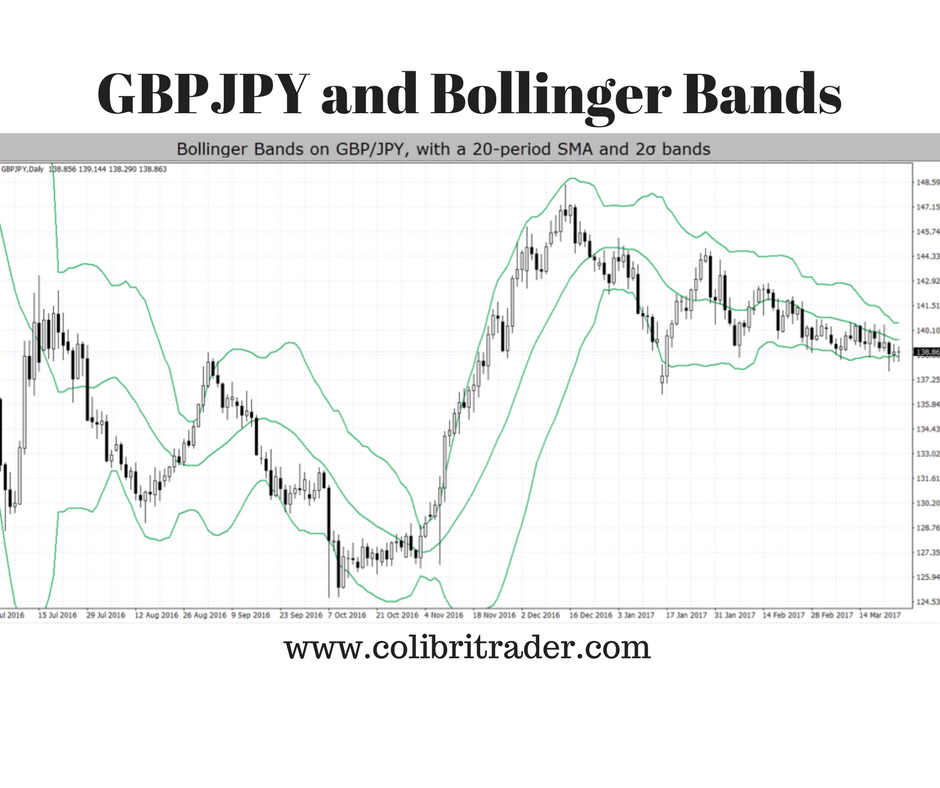
The chart above shows the Bollinger Bands plotted on GBP/JPY, with standard parameters of a 20-period SMA and upper and lower bands plotted at two standard deviations away from the moving average. Note how during more volatile periods the bands widen (left side of the chart), and contract during less volatile periods (right side of the chart). This happens because a standard deviation is measuring the dispersal pattern of a data set, i.e. it is a measure of volatility. By definition, one standard deviation includes 68% of price-action from the moving average, while two standard deviations include about 95% of all price action.
The bands also act as strong support and resistance levels for the currency pair, and the pair rarely trades outside the bands. Traders should not rely solely on Bollinger Bands for trading signals. Best results are achieved when combining with other non-oscillator indicators, like candlestick patterns or chart patterns. Another popular technical-trading approach is combining Bollinger Bands with MACDand RSI. Bollinger Bands are not a standalone trading system, and they don’t provide information about the future direction will take place. They simply measure the price volatility according to standard deviation calculations of the moving average. John Bollinger suggests combining other technical indicators based on price direction for confirming price direction and placing trades.
However, the upper and lower bands are still often used as price targets by traders. The usual strategy used with Bollinger Bands is waiting for the price bouncing off the bands, and taking the opposite band as a price target. If the price touches the lower band and reverses, crosses above the middle band, then the upper band is considered the next price target. If the price bounces off the upper band, crosses the middle line (moving average), then the lower band is considered as the next price target. Another use of Bollinger Bands is for spotting overbought and oversold conditions. If the price reaches the upper band, it is usually considered an overbought area which implies opening a short position, and vice-versa.
Although the standard settings used for Bollinger Bands (N=20, 2σ) are recommended by John Bollinger, they can be changed to adjust for a particular security or trading strategy. As the number of periods used for the moving average are also used for calculating the standard deviation of the moving average, only small adjustments are needed in the standard deviation multiplier. Bollinger’s suggestion for a 50-period SMA is to increase the standard deviation multiplier to 2.1, and for a 10-period SMA to decrease the multiplier to 1.9. While making adjustments to the standard settings, traders should make sure that the majority of price-action is still taking place inside the bands. In case the pair never trades outside the bands, a smaller multiplier is required; while the opposite is true if the price breaks the bands too often.
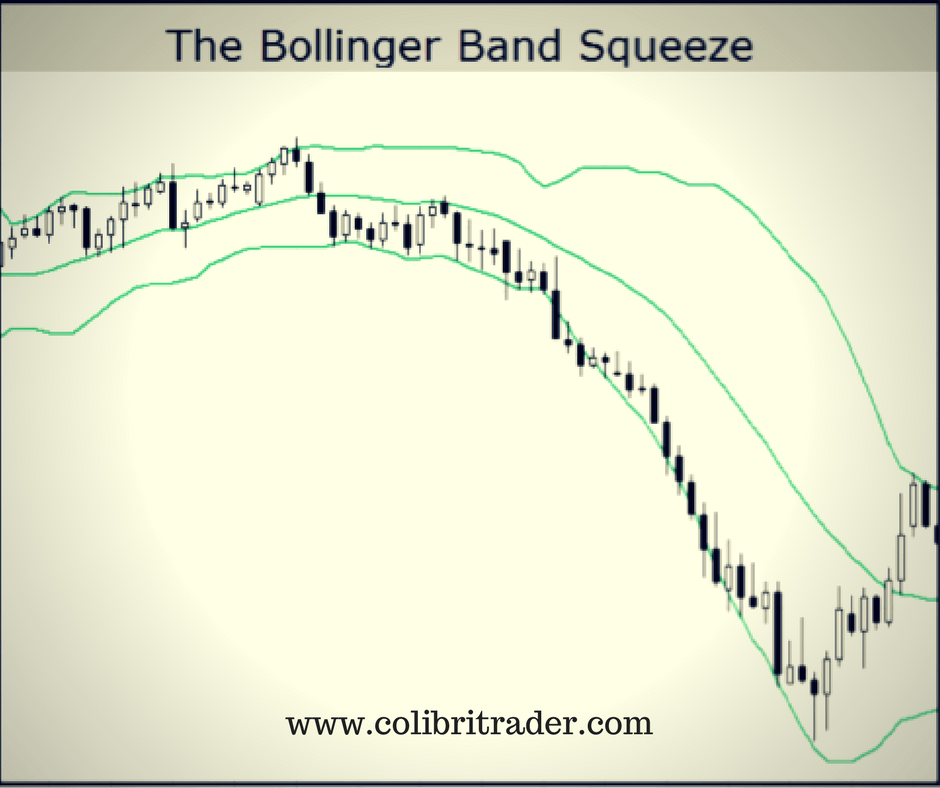
The Squeeze
When the bands come very close together, and the distance from the moving average becomes very small, it is called a squeeze. This market condition implies very low volatility, and traders should be prepared for a possible increase in future market volatility and trading opportunities. The opposite situation, in which the bands are wider apart, means that the market volatility is very high. In this case traders should prepare for a decrease in volatility and eventually consider exiting a position. The following chart shows a squeeze with a succeeding rise in price volatility.
The Breakout
A breakout occurs when the price closes outside the upper or lower band. This situation is very rare, as 90-95% of all market activity is taking place inside the bands, so far as the standard setting for the standard deviation multiplier is used (K=2). A breakout is therefore a major event, but it doesn’t provide a complete trading signal, because the future direction of the price or time when a breakout will occur are unknown. Therefore, John Bollinger suggests using other direction-based indicators for entering a trade. The following chart shows a fake breakout:
Some traders also use a breakout for entering a trade. Because the bands act as support and resistance lines, a breakout of the price outside these bands is considered a potential trading possibility. In the next chart, we show a breakout trade setup on EUR/GBP, with Bollinger Bands (20,2).
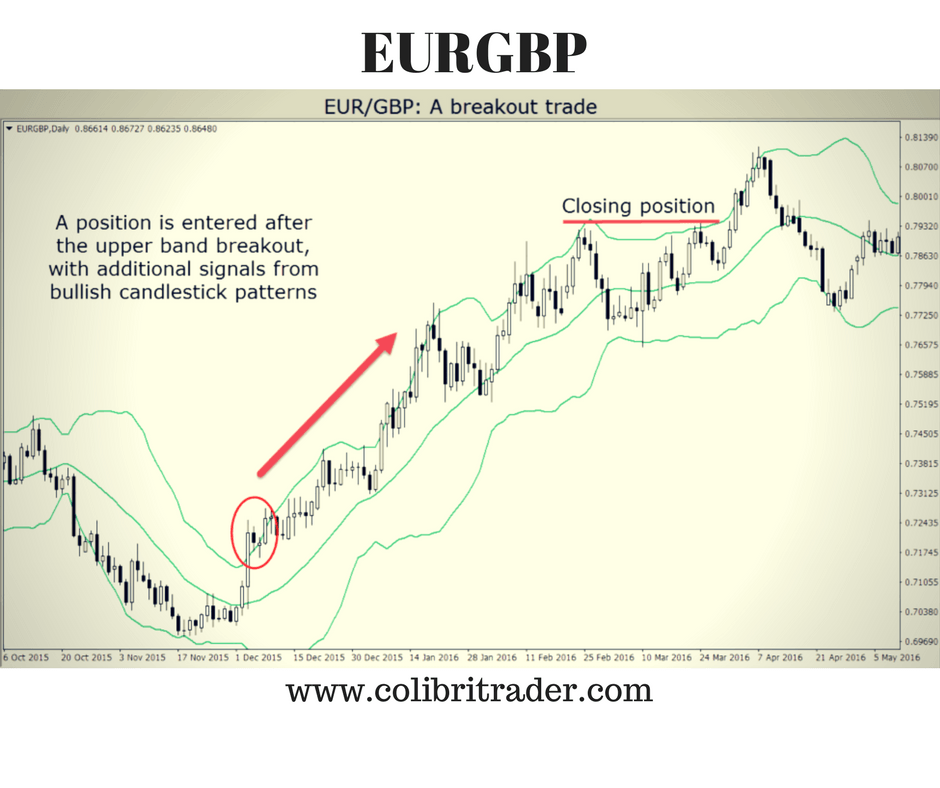
In the beginning of December 2015, the price moved outside the upper band with a long bullish candlestick. To confirm the breakout, a trader should wait for a second signal, which in this case give the following candlestick patterns. The next period after the breakout, a small black candlestick appears, with high and close prices inside the previous candlestick’s body. This is the first signal showing the dominance of buyers. The next period, forming a bullish long-shadow candlestick, and with a close just on the border of the upper band, confirms once more that an uptrend is possibly ahead. Now it is time to enter a long position.
The pair trades the next few months close to the upper band, with a few fake breakouts, and touches quite often the middle band, i.e. the 20-period moving average. The position should be closed either when the price falls to the lower band, or the trend shows signs of exhaustion. In this case, the price failed to make a new higher high on the 24th of March 2016, forming a double top with the upper band acting as a resistance level. This is a level where trader would consider exiting the position.
Riding the Bands
Another popular strategy based on Bollinger Bands, is riding the bands. During powerful down and uptrends, the price tends to stick to the lower and upper bands, respectively. This shows that there is still enough steam behind the trend, and that it will likely continue in the future. As mentioned before, plotting the bands two standard deviations away from the moving average, means that almost 90-95% of the price-action is contained inside the bands. A price sticking to one of the bands, is therefore a major statistical event which happens in exceptional conditions, like changes in the currency fundamentals.
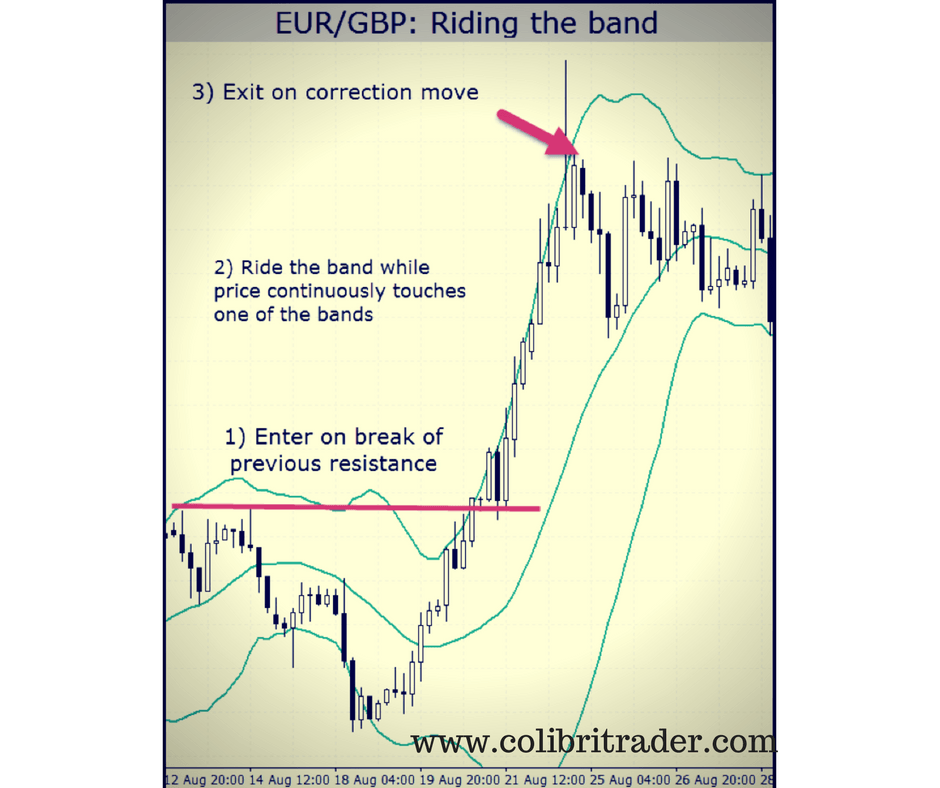
The chart above shows the EUR/GBP pair on H4 timeframe. On 20th of August 2016, the price broke the previous high and traded outside the upper band for a while. Opening a long position after the break of resistance would give the opportunity to ride the upper band, as the price has touched the upper band until 25th of August. After the price closed away from the band, traders should close the long position with a nice profit in the account.
Conclusion
Bollinger Bands are an effective tool in the trader’s arsenal if used the proper way. The upper and lower bands show the volatility of the price, because they are based on standard deviation calculations. About 90% of all price-action takes place inside the bands, and any breakout outside the bands is a major event. The breakout itself is not considered a trading signal, as it provides no clue about the direction or extent of the price movement. Although fake breakouts occur quite often in the standard settings (N=20 and K=2), a trader should investigate if the increasing market volatility has a fundamental background. Bollinger Bands are also not a standalone trading strategy, and should be combined with other technical indicators which rely on a different set of data, like price patterns and trendlines.
Author

Colibri Trader
Colibri Trader
Colibri Trader, as he is known in the circles, is based in London, UK. He Started his career in one of the leading prop trading houses at the time and then has moved out to form his own company- Colibri Trader Limited.


