When trading, you will hear about the “bid and ask price.”

What is it, and how do you use it?

What is the Bid and Ask Price?

Very easy: 
– The “Bid” is the price that buyers are willing to pay for a stock and
– The “Ask” is the price that sellers are willing to sell a stock for.

Here’s an example:

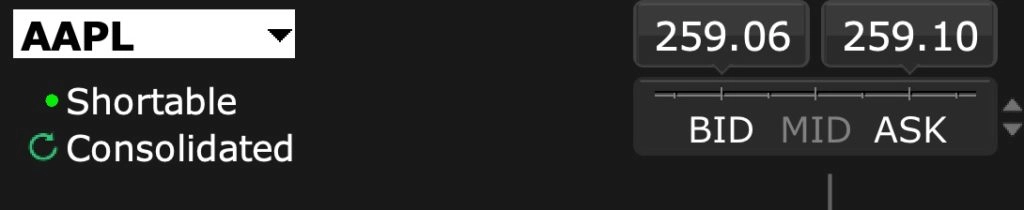
In this example, buyers are willing to pay $259.06 for Apple (AAPL), but sellers want at least $259.10 per share.

Let’s think about it for a moment:

Some people think that the exchange is determining the price of a stock.

And that’s not the case!

The price of a stock is determined by the price that buyers and sellers are willing to trade at.

Let me give you an example:

When you walk into an art gallery and see a painting with a price tag of $30,000, then THIS is the asking price of the seller of the painting. 

It’s NOT the “fair price.”

It’s simply a price that the seller would like to get when selling the painting.

He’s “asking” for it.

You, as a potential buyer, could now offer – or bid –  $20,000.

Now the seller has 2 choices:

  • He can accept your bid or
  • He can lower his asking price and see if you’re willing to buy the painting at a lower price.

As you can see, the final “trade price” is determined by the price that the buyer and seller agree on.

Same with stocks: 

The “last price” of a stock is the price that buyers and sellers agreed on.

That’s the price a trade was made.

However, you can not buy a stock at the last price traded.

If you want to buy a stock, you have to find a seller who’s willing to sell to you. 

Why Is The Bid And Ask Price So Different?

Sometimes you will see that the bid and ask price is very different.

Here’s an example:

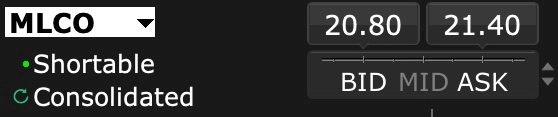
In this example, buyers are willing to pay $20.80 (BID) for this stock, but sellers want at least $21.50 (ASK).

The difference between the bid and ask price is called “the spread,” and in this example, the spread is $0.60. 

In the previous example with Apple stock, the “bid/ask spread” was only $0.04.

So why is the bid and ask price for this stock so different?

A large bid and ask spread is usually caused by one of the following 2 conditions:

  • You’re looking at a stock with low trading volume, i.e. there are simply not many buyers and sellers or
  • You’re looking at the stock during “after hours”, i.e. outside regular trading hours. 

If that’s the case, then you will see the bid/ask spread tighten immediately after the open. 

In the example above, I took the screenshot 5 min before the open.

Shortly after the open, the bid/ask spread was much smaller:

What Is a Normal Bid/Ask Spread?

When trading stocks, a “normal” bid/ask spread is usually $0.01 – $0.04.

Whenever you see a larger bid/ask spread, you are either looking at a stock that’s not very liquid, or you’re looking at the stock outside of regular trading hours.

For options, a “normal”  bid/ask spread is $0.05 – $0.20 for 2 reasons:

  1. Most options are trading in $0.05 increments, i.e. $1.10, $1.15, $1.20 etc.
  1. Options are not as liquid as stocks. Only a fraction of traders are trading options, therefore, there are fewer buyers and sellers.

Should I Buy At The Bid Or Ask Price?

Let’s review:

The BID is the price that buyers are willing to pay for a stock, and it’s usually lower than the ASK.

It would be GREAT if we could buy at the bid price, but most of the time, that’s not possible.

We can either buy a stock at the ask price, or we can make an offer that’s between the current bid and ask and see if one of the sellers is willing to take the trade.

Here’s an example:

fxsoriginal

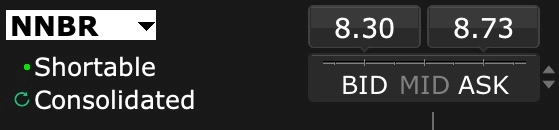
Buyers are willing to pay a maximum of $8.30 for this stock, but sellers want $8.73.

If you wanted to buy the stock, you could offer $8.40 and see if a seller is willing to sell you the stock at that price.

Often traders split the difference and offer a price in the middle, a.k.a. the “mid” price.

This brings us to the next question:

Can You Buy Stock For Less Than The Ask Price?

Absolutely!

When you step out of the pool of buyers and offer a higher price than everybody else, you might find a seller who’s willing to take your bid.

In the example above, the bid is $8.30 and the ask is $8.73.

So the “mid-price” would be $8.52.

If you would raise your bid to $8.50 or $8.55, which is close to the mid-price, it is very likely that there’s a seller who is willing to take your bid.

It’s VERY important that you know what order to use if you try to bait sellers.

Fortunately, I have an article for you that explains “The Difference Between A Stop Order And A Limit Order.”

In a nutshell, if you want to buy a stock for less than the asking price, you should use a limit order

Now you know what the bid and ask price is and how to use it in your trading.


Trading Futures, options on futures and retail off-exchange foreign currency transactions involves substantial risk of loss and is not suitable for all investors. You should carefully consider whether trading is suitable for you in light of your circumstances, knowledge, and financial resources. You may lose all or more of your initial investment. The lower the day trade margin, the higher the leverage and riskier the trade. Leverage can work for you as well as against you; it magnifies gains as well as losses. Past performance is not necessarily indicative of future results.

Editors’ Picks

EUR/USD trims gains, nears 1.1700

EUR/USD trims gains, nears 1.1700

The EUR/USD pair eases in the American afternoon and approaches the 1.1700 mark. The pair surged earlier in the day after the ECB left interest rates unchanged and upwardly revised inflation and growth figures. The US CPI rose 2.7% YoY in November, nearing Fed’s goal.

GBP/USD returns to 1.3370 after BoE, US CPI

GBP/USD returns to 1.3370 after BoE, US CPI

The GBP/USD pair jumped towards the 1.3440 early in the day, following the BoE decision to cut rates, and US CPI data, which was much softer than anticipated. The US Dollar, however, managed to regain the ground lost during US trading hours.

USD/JPY rises to near 156.00 ahead of US CPI data, BoJ policy decision

USD/JPY rises to near 156.00 ahead of US CPI data, BoJ policy decision

USD/JPY moves higher to near 156.00 in the countdown to the US inflation data. Fed’s Bostic sees inflation more worrying than the job market. The BoJ is expected to raise interest rates by 25 bps to 0.75% on Friday.


Editors’ Picks

EUR/USD trims gains, nears 1.1700

EUR/USD trims gains, nears 1.1700

The EUR/USD pair eases in the American afternoon and approaches the 1.1700 mark. The pair surged earlier in the day after the ECB left interest rates unchanged and upwardly revised inflation and growth figures. The US CPI rose 2.7% YoY in November, nearing Fed’s goal.

GBP/USD returns to 1.3370 after BoE, US CPI

GBP/USD returns to 1.3370 after BoE, US CPI

The GBP/USD pair jumped towards the 1.3440 early in the day, following the BoE decision to cut rates, and US CPI data, which was much softer than anticipated. The US Dollar, however, managed to regain the ground lost during US trading hours.

Gold extends its consolidative phase around $4,330

Gold extends its consolidative phase around $4,330

The bright metal cannot attract speculative interest on Thursday, despite central banks announcements and the United States latest inflation update. XAU/USD is stuck around $4,330, confined to a tight intraday range.

Crypto Today: Bitcoin, Ethereum hold steady while XRP slides amid mixed ETF flows

Crypto Today: Bitcoin, Ethereum hold steady while XRP slides amid mixed ETF flows

Bitcoin eyes short-term breakout above $87,000, underpinned by a significant increase in ETF inflows. Ethereum defends support around $2,800 as mild ETF outflows suppress its recovery. XRP holds above at $1.82 amid bearish technical signals and persistent inflows into ETFs.

Bank of England cuts rates in heavily divided decision

Bank of England cuts rates in heavily divided decision

The Bank of England has cut rates to 3.75%, but the decision was more hawkish than expected, leaving market rates higher and sterling slightly stronger. It's a close call whether the Bank cuts again in February or March.

RECOMMENDED LESSONS

5 Forex News Events You Need To Know

In the fast moving world of currency markets where huge moves can seemingly come from nowhere, it is extremely important for new traders to learn about the various economic indicators and forex news events and releases that shape the markets. Indeed, quickly getting a handle on which data to look out for, what it means, and how to trade it can see new traders quickly become far more profitable and sets up the road to long term success.

Top 10 Chart Patterns Every Trader Should Know

Chart patterns are one of the most effective trading tools for a trader. They are pure price-action, and form on the basis of underlying buying and selling pressure. Chart patterns have a proven track-record, and traders use them to identify continuation or reversal signals, to open positions and identify price targets.

7 Ways to Avoid Forex Scams

The forex industry is recently seeing more and more scams. Here are 7 ways to avoid losing your money in such scams: Forex scams are becoming frequent. Michael Greenberg reports on luxurious expenses, including a submarine bought from the money taken from forex traders. Here’s another report of a forex fraud. So, how can we avoid falling in such forex scams?

What Are the 10 Fatal Mistakes Traders Make

Trading is exciting. Trading is hard. Trading is extremely hard. Some say that it takes more than 10,000 hours to master. Others believe that trading is the way to quick riches. They might be both wrong. What is important to know that no matter how experienced you are, mistakes will be part of the trading process.

Strategy

Money Management

Psychology

Best Brokers of 2025