Australia and China: The Trading Relationship

Many of us have traded an AUD currency pair, left the position overnight and then came back to see an “inexplicable” large move. There was no Australian data, no data for the other currency in the pair and no speaker for either of the currency pairs. That move was in fact a result of a large miss or beat for key Chinese data. But why does AUD move when Chinese data is released?
China is the largest trading partner of Australia, with China consuming around 33% of Australia’s exports such as iron ore, coal, copper, gold and other commodities. Strong performance of China’s economy usually suggests that Chinese demand for Australian commodities will increase, and vice versa for when the Chinese economy performs poorly. During my time as a professional Market Analyst, we would often see a positive correlation between the Chinese stock markets and copper when stocks were higher for the day. This is because speculators assume that when companies are doing well they will seek to expand, and while doing so will purchase raw materials, such as copper, in order to build infrastructure; thus increasing demand and price for the metal.
So, when we see a high volatility Chinese data release, we can expect a reaction in the AUD. A worse-than-expected value indicates poor performance for China, and will lead to a weaker AUD due to the assumption that demand from the Chinese for Australian commodities will fall. We see the opposite reaction for AUD when a better-than-expected value is released. As explained, a negative data release from China affects AUD, and in the long term will affect the growth of Australia, due to the decreasing demand for Australian commodities. The Australian economy relies on exports to drive aggregate demand as the export of goods accounts for around 20% of the nation’s GDP.
The data that has the greatest effect on AUD and the Australian economy I sChinese CPI. To simplify, Chinese CPI has an indirect effect on Australian CPI. If the former falls, the latter is likely to follow, and in turn leads to the RBA using lower rates to stimulate the economy. When Chinese CPI is trending either higher or lower, we then know that there is a high probability that Australian CPI will soon follow that same trend.
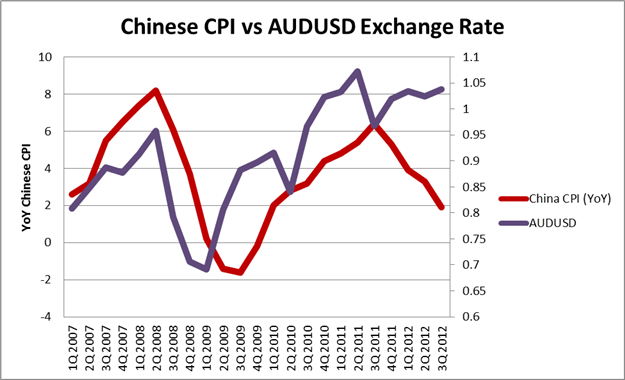
(source: Trading Economics)
The chart above shows the relationship between Chinese CPI and the AUD/USD exchange from 2007-2012. As We can see, AUD/USD lags behind Chinese CPI. We can also see some divergence in the latter part of the chart as Chinese CPI continued lower to near 3-year lows, however the general relationship has since resumed. When trading, it is important to keep an eye on Chinese CPI projections as well as the current trend, in order to construct detailed fundamental analysis.
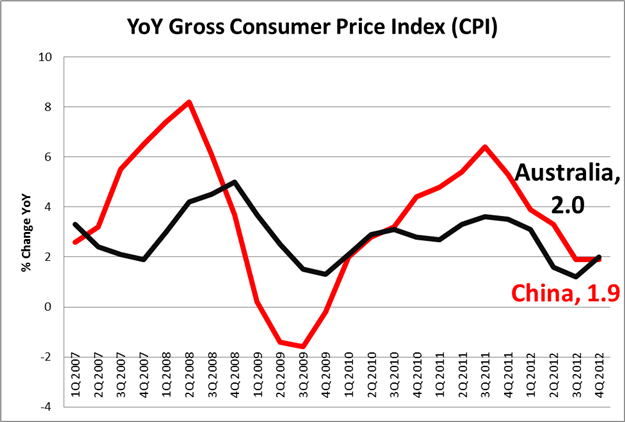
(source: Trading Economics)
The chart above shows the relationship between CPI Y/Y for both Australia (black) and China (red). Once again, some correlation can be seen, with Australia lagging behind.
To conclude, it is now clear to see why China has a large effect on the Australian economy and currency. With this knowledge, we can have an edge in the market as we have a deeper understanding of the fundamentals that influence these two trade partners.
Author

Troy Scott
SB Forex
Troy is from a medical background and holds a Clinical Physiology degree. In 2013, he discovered his passion for forex and began trading independently.


