Firstly, let me wish you a very happy New Year! I hope 2018 brings you much health, happiness and joy! When I write these articles, I like to offer some practical and, hopefully, insightful slices of information to help the trading journey go all that much smoother. Today, after an eventful first trading week in the financial markets, I wanted to share some insights on using The Commitment of Traders Report for our long-term speculation.
The COT (Commitment of Traders) report, while directly linked to the futures market, can still be used as a highly useful resource for Forex trading as well. This is especially true for those currency traders among us who like to engage in regular trading activity on the likes of the major pairs like EURUSD, GBPUSD and AUDUSD. In fact, COT can be used for any of the Major Dollar-based FX pairs and even the Dollar Index itself, as these pairs are all available to trade as liquid futures contracts which directly mirror their spot market counterparts, while the Dollar Index futures which trade on the Intercontinental Exchange (ICE) parallels the cash Dollar Index. Unfortunately, we do have to exclude cross-pairs like the GBPCAD or EURJPY; these pairs do have futures contracts, but they are highly illiquid and therefore are not ideal to actively trade.
What is the Commitment of Traders Report
The Commitment of Traders Report is a report released by the Commodity Futures Trading Commission (CFTC) every Friday at 3:30 Eastern Time. The report reflects the commitments of traders on the prior Tuesday. The weekly report details trader positions in most of the futures contract markets in the United States. Data for the report is required by the CFTC from traders in markets that have 20 or more traders holding positions large enough to meet the reporting level established by the CFTC for each of those markets. This data is gathered from schedules electronically submitted each week to the CFTC by market participants listing their position in any market for which they meet the reporting criteria.
The report provides a breakdown of aggregate positions held by three different types of traders:
-
commercial traders
-
non-commercial traders
-
non-reportables
Commercial Traders (Hedgers)
As we would expect, the largest positions are held by commercial traders that actually provide a commodity or instrument to the market, or have bought a contract to take delivery of it. Thus, as a general rule, more than half the open interest in most of these markets is held by commercial traders.
Non-commercial Traders (Large Speculators) and Non-reportables (Small Speculators)
Speculators are market participants that are not able to deliver on a contract or that have no need for the underlying commodity or instrument. They are buying or selling only to speculate that they will exit their position at a profit, and plan to close their “seller” or “buyer” position before the contract becomes due.
In most of these markets, the majority of the open interest in these speculator positions is held by non-commercial traders whose positions are large enough to meet reporting requirements. The remaining contract holders are referred to by the CFTC as non-reportable. This is because they don’t meet the position size that requires reporting to the CFTC, thus making them the small speculators. The non-reportable open interest in a futures market is determined by subtracting the open interest of the commercial traders plus non-commercial traders from the total open interest in that market. As a rule, the aggregate of all traders’ positions reported to the CFTC represents 70 to 90 percent of the total open interest in any given market.
If you do a search for the COT report online, you will be able to easily find a link to it. If you are having trouble, then you can always check www.cftc.gov for more information. Below is a screen shot of the current COT report for the EURO FX Futures Contract traded on the Chicago Mercantile Exchange:
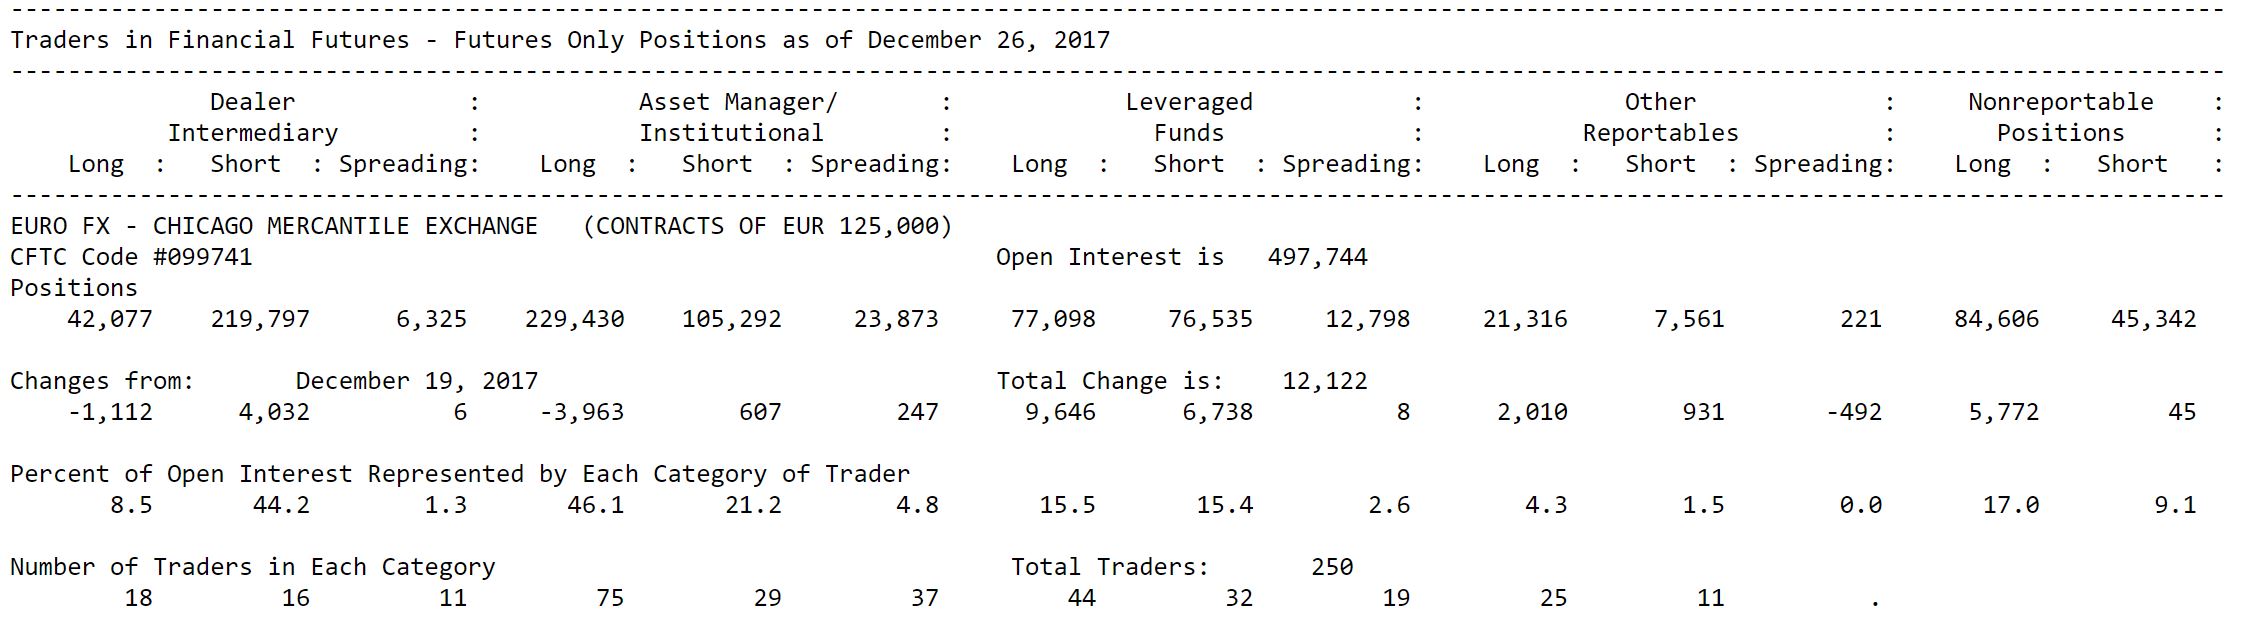
The above illustration shows the net positions of the three groups I mentioned earlier. The green line is the change in the Open Interest. Please be aware however, that it is normal to see regular dips in the Open Interest around expiry and rollover of futures contracts, as trader close out their positions only to reopen in the next contract month. The above data would be an ideal analytical tool for speculation on the EURO FX Futures or the EURUSD spot market. As an added bonus, if you are a TradeStation user you can also get hold of this same COT information as a study which is built into the platform (but you will need the necessary futures feed to access it. It looks something like this:
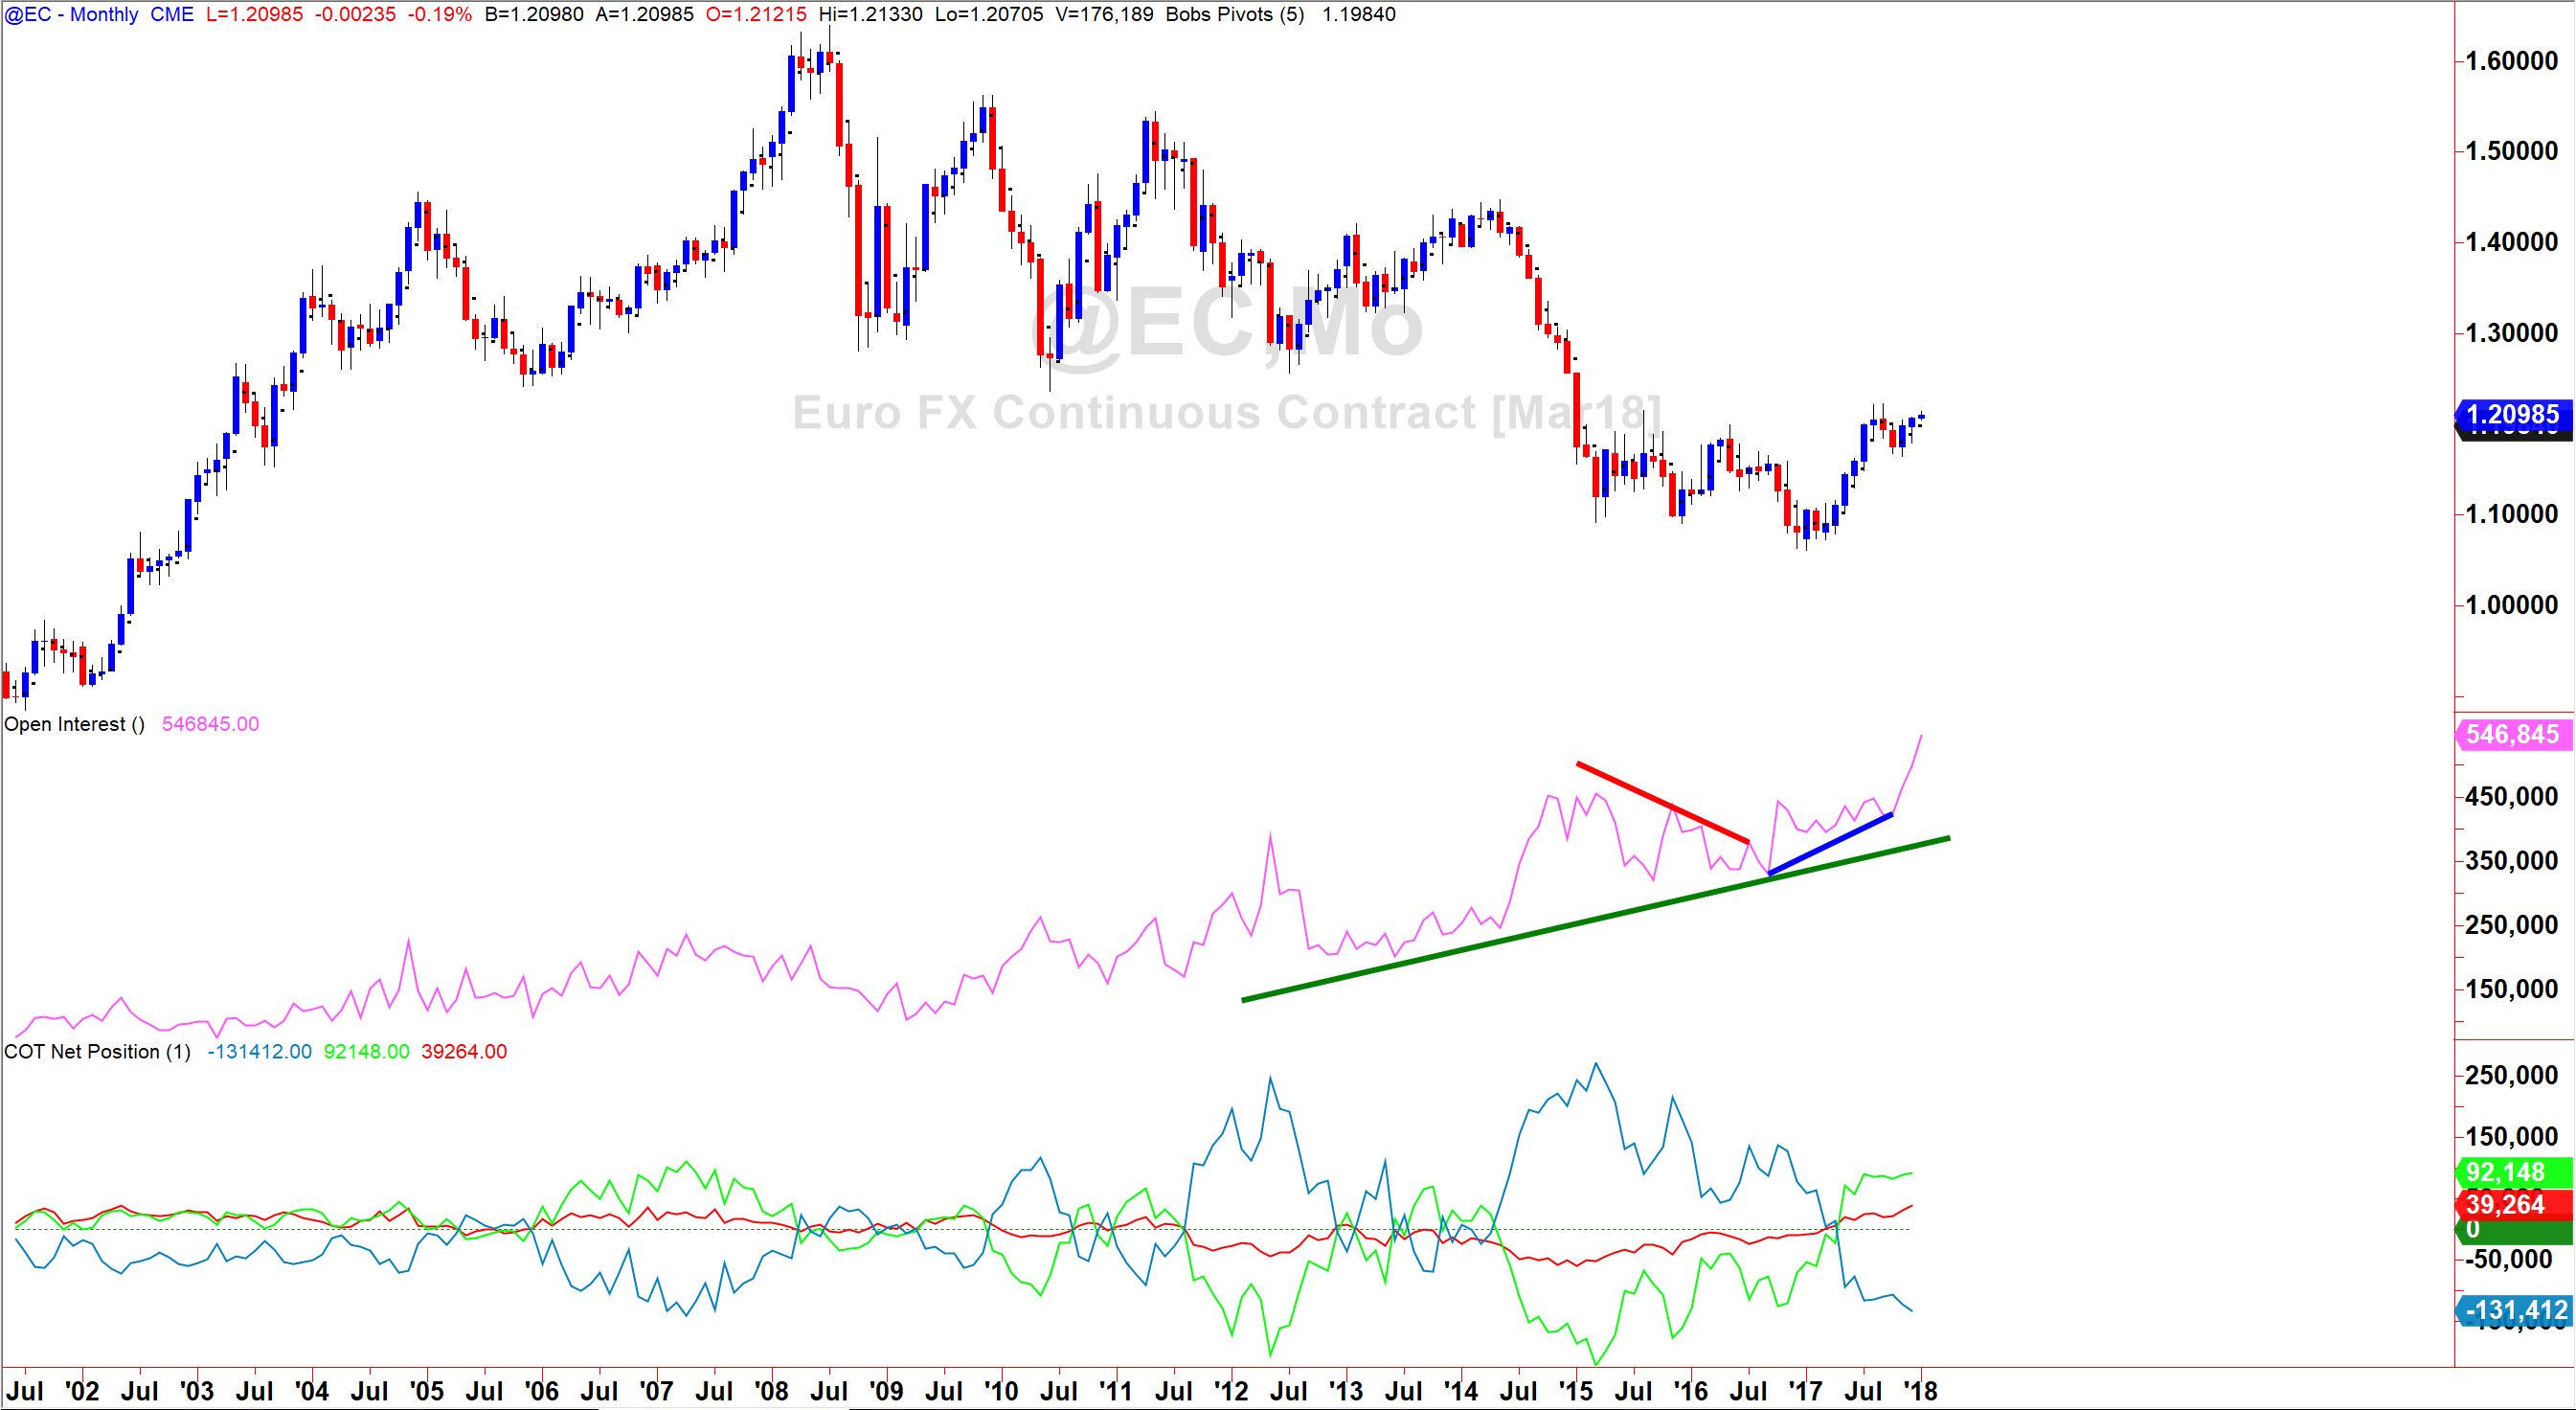
In the above monthly chart, we can see there has been a steady downtrend for 4 years with open interest as the magenta line, rising as the trend got stronger, then it dipped a little (my red line) as the trend ran out of steam, only to then pick up again as more people entered the market for the more recent uptrend (my blue line). The bottom graph shows the public in red, the commercial hedgers in blue (who typically hold positions in the opposite direction of the trend) and the large institutions in green. If the lines are above zero they are net long and below means net short. This is a great study of where the “money” is in the market, albeit lagging.
I find this useful for comparing the COT directly with the chart of the pair itself, which in this case is the EURUSD futures. I pay particular attention to the change in Open Interest by using a simple logic in conjunction with my price action analysis of trend and Supply and Demand. For example, we can interpret the changes in Open Interest in the following manner:
PRICE RISING & OPEN INTEREST RISING = MARKET IS GETTING STRONGER
PRICE RISING & OPEN INTERST FALLING = MARKET IS GETTING WEAKER
PRICE FALLING & OPEN INTEREST FALLING = MARKET IS GETTING STRONGER
PRICE FALLING & OPEN INTEREST RISING = MARKET IS GETTING WEAKER
While it should be noted in advance that the COT report is lagging in nature, it does offer the disciplined trader an insight into the behavior of the key market speculator groups and can be used as a complimentary analytical tool for the longer term position trader and swing trader alike. While the data may be generated from futures market activity, it can easily be used as a reflection of what to expect in the Spot FX arena too, as both markets trade in line with one another. Remember that technical analysis is more of an art than a science, especially when we incorporate the use of indicators like the COT; but if they are used in a disciplined manner alongside a solid and detailed trade plan, they can become a useful tool in the competent market speculator’s tool bag. I hope you found this useful.
The information provided is for informational purposes only. It does not constitute any form of advice or recommendation to buy or sell any securities or adopt any investment strategy mentioned. It is intended only to provide observations and views of the author(s) or hosts at the time of writing or presenting, both of which are subject to change at any time without prior notice. The information provided does not have regard to specific investment objectives, financial situation, or specific needs of any specific person who may read it. Investors should determine for themselves whether a particular service or product is suitable for their investment needs or should seek such professional advice for their particular situation. Please see our website for more information: https://bustamanteco.com/privacy-policy/
Editors’ Picks

EUR/USD weakens to near 1.1900 as traders eye US data
EUR/USD eases to near 1.1900 in Tuesday's European trading hours, snapping the two-day winning streak. Markets turn cautious, lifting the haven demand for the US Dollar ahead of the release of key US economic data, including Retail Sales and ADP Employment Change 4-week average.

GBP/USD stays in the red below 1.3700 on renewed USD demand
GBP/USD trades on a weaker note below 1.3700 in the European session on Tuesday. The pair faces challenges due to renewed US Dollar demand, UK political risks and rising expectations of a March Bank of England rate cut. The immediate focus is now on the US Retail Sales data.

USD/JPY drops toward 155.00 as focus shifts to US data
USD/JPY meets fresh supply and inches closer toward 155.00 in the Asian session on Tuesday. The Japanese Yen holds the upper hand over the US Dollar after Japanese Prime Minister Sanae Takaichi led the ruling Liberal Democratic Party to a historic landslide win and on intervention talks. Traders brace for key US economic data that could offer more clues on the Federal Reserve's monetary policy.
Editors’ Picks
EUR/USD weakens to near 1.1900 as traders eye US data
EUR/USD eases to near 1.1900 in Tuesday's European trading hours, snapping the two-day winning streak. Markets turn cautious, lifting the haven demand for the US Dollar ahead of the release of key US economic data, including Retail Sales and ADP Employment Change 4-week average.
GBP/USD stays in the red below 1.3700 on renewed USD demand
GBP/USD trades on a weaker note below 1.3700 in the European session on Tuesday. The pair faces challenges due to renewed US Dollar demand, UK political risks and rising expectations of a March Bank of England rate cut. The immediate focus is now on the US Retail Sales data.

Gold sticks to modest losses above $5,000 ahead of US data
Gold sticks to modest intraday losses through the first half of the European session, though it holds comfortably above the $5,000 psychological mark and the daily swing low. The outcome of Japan's snap election on Sunday removes political uncertainty, which along with signs of easing tensions in the Middle East, remains supportive of the upbeat market mood. This turns out to be a key factor exerting downward pressure on the safe-haven precious metal.

Bitcoin Cash trades lower, risks dead-cat bounce amid bearish signals
Bitcoin Cash trades in the red below $522 at the time of writing on Tuesday, after multiple rejections at key resistance. BCH’s derivatives and on-chain indicators point to growing bearish sentiment and raise the risk of a dead-cat bounce toward lower support levels.

Follow the money, what USD/JPY in Tokyo is really telling you
Over the past two Tokyo sessions, this has not been a rate story. Not even close. Interest rate differentials have been spectators, not drivers. What has moved USD/JPY in local hours has been flow and flow alone.
RECOMMENDED LESSONS
Making money in forex is easy if you know how the bankers trade!
I’m often mystified in my educational forex articles why so many traders struggle to make consistent money out of forex trading. The answer has more to do with what they don’t know than what they do know. After working in investment banks for 20 years many of which were as a Chief trader its second knowledge how to extract cash out of the market.
5 Forex News Events You Need To Know
In the fast moving world of currency markets where huge moves can seemingly come from nowhere, it is extremely important for new traders to learn about the various economic indicators and forex news events and releases that shape the markets. Indeed, quickly getting a handle on which data to look out for, what it means, and how to trade it can see new traders quickly become far more profitable and sets up the road to long term success.
Top 10 Chart Patterns Every Trader Should Know
Chart patterns are one of the most effective trading tools for a trader. They are pure price-action, and form on the basis of underlying buying and selling pressure. Chart patterns have a proven track-record, and traders use them to identify continuation or reversal signals, to open positions and identify price targets.
7 Ways to Avoid Forex Scams
The forex industry is recently seeing more and more scams. Here are 7 ways to avoid losing your money in such scams: Forex scams are becoming frequent. Michael Greenberg reports on luxurious expenses, including a submarine bought from the money taken from forex traders. Here’s another report of a forex fraud. So, how can we avoid falling in such forex scams?
What Are the 10 Fatal Mistakes Traders Make
Trading is exciting. Trading is hard. Trading is extremely hard. Some say that it takes more than 10,000 hours to master. Others believe that trading is the way to quick riches. They might be both wrong. What is important to know that no matter how experienced you are, mistakes will be part of the trading process.
The challenge: Timing the market and trader psychology
Successful trading often comes down to timing – entering and exiting trades at the right moments. Yet timing the market is notoriously difficult, largely because human psychology can derail even the best plans. Two powerful emotions in particular – fear and greed – tend to drive trading decisions off course.