Fibonacci numbers/ratio are an integral part of technical analysis. Entire concepts and trading theories were based on them.
Traders always strive to get into a trade at the right moment. What would the right moment be?
In a bullish trend, they’re afraid to buy the highs. The fear of buying at the top is too big. In a bearish one, the opposite happens.
So, what is the answer? Fibonacci. That is the tool that helps traders enter in a trade after a pullback.
Typically, this pullback is anywhere between 38.2% and 61.8%. Depending on the strategy different entering techniques are used (scaling, etc.).
But, trading a Fibonacci retracement or expansion level is something common. Is there anything else surrounding the Fibo levels?
While I preach price action and am a big fan of it, here’s how Advanced Fibonacci Strategies are used in ways not known for every trader. At the end of this article, I’m sure you’ll look at the Fibonacci ratios/levels with different eyes.
Advanced Fibonacci Strategies- Dynamic Support and Resistance with Fibonacci Ratios
Traders use the Fibonacci numbers to find support and resistance. The more elements in the same place, the more difficult the level to break.
Moreover, the bigger the time frame, the stronger the support/resistance is.
But, those levels form horizontally. However, horizontal support and resistance levels are not always the most important ones. Although I prefer horizontal, dynamic levels work quite good, as well.
As usual, they should be treated as part of a money management system. This way, everything related to risk is kept under control.
But, what is a dynamic level?
As mentioned above, if classic support and resistance levels form on the horizontal, a dynamic level is not.
Price can meet support/resistance on a rising/falling level. That’s where dynamic comes from.
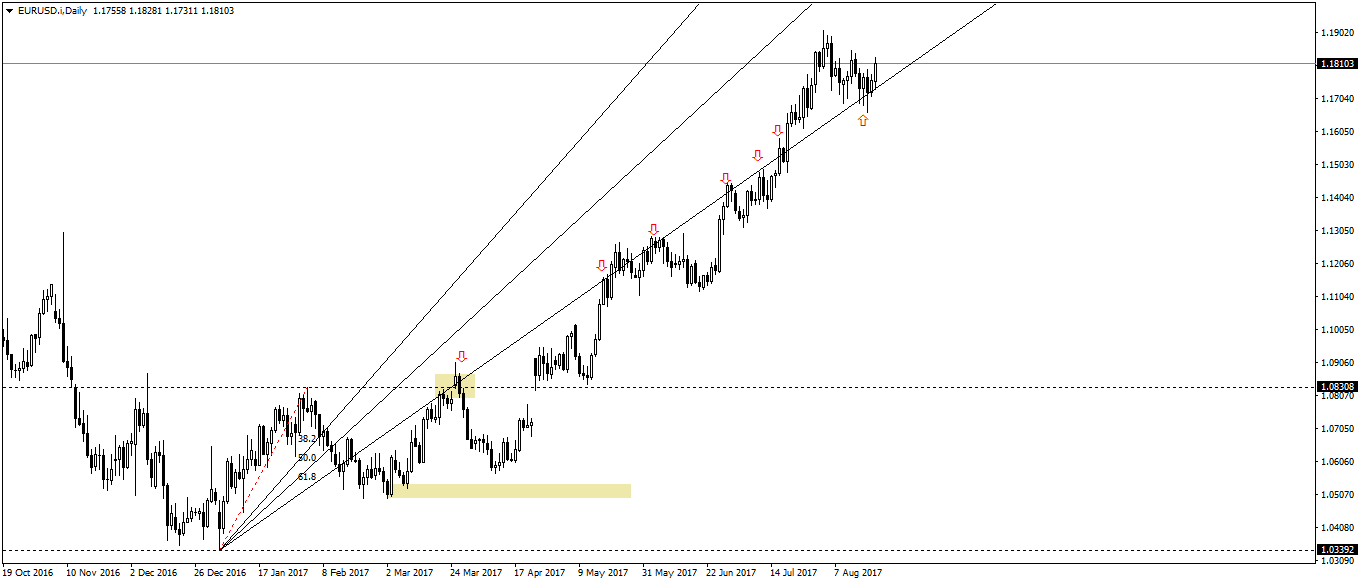
Above is the EURUSD daily time frame. It shows the recent move that started this spring.
The key here is to use the golden ratio (61.8%) to find dynamic support and resistance levels. Given the time frame (daily), the resulting levels are great for quick rejections and intra-day/intra-week trading opportunities.
For trading resulting dynamic/support levels, the tool to use is the Fibonacci Fan.
Advanced Fibonacci Strategies- How to Set It Up
Any Metatrader platform offers it under the Fibonacci tools tab.
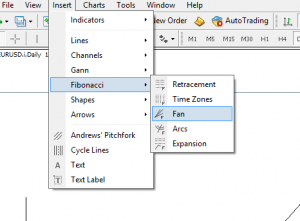
The following steps represent a quick guide on how-to-use it:
- After the bottom, wait for the market to make a new swing higher. Then, look for a pullback that doesn’t take the previous swing’s lows.
- Look for the price to come higher and form a new high. That’s the key to everything: from the bottom, we have a swing higher, followed by a pullback that didn’t break the lows, and then a new high comes.
- From this moment, we can use the Fibonacci Fan. Simply click and drag the tool from the absolute low to the end of the first swing higher.
- The tool has, by default, three lines: 38.2%, 50%, and 61.8%. Our main interest is the price action surrounding the 61.8% rising trend line. It gives both dynamic resistance and support for the months to come.
Find The Trading Opportunities While Using Advanced Fibonacci Strategies
No less than seven opportunities on the daily time frame arose from such a simple, yet powerful setup. Now, imagine the opportunities in the long-term!
Consider just how many currency pairs are out there. Now, multiply them by the timeframes…
Infinite!
By using the four steps above and the Fibonacci Fan tool, endless opportunities arise.
This in no way should be a reason for you to overtrade. Indeed, the less often you place a trade, the more time you will have to pick the best trades amongst trades.
Also, I want to make it clear that I am not using Fibonacci tools in my trading. They are an excellent tool but I have my own trading strategy, which many amongst you have already learnt.
I just like to stick to what works and not jump from one system to another.
This article is for educational purposes only and maybe you can pick a few bits and pieces to help you become a better trader by learning a new concept and applying an advanced fibonacci strategy.
Identifying Cycles with Fibonacci Time Zones
Price and time- the holy grail in trading. Ever since technical analysis exists, traders were fascinated about the time element.
The thing is that when trading, everyone’s focus is on price levels. That’s absolutely correct! But, it is not everything.
What if we can have an idea about when the price will reach a specific level? What if we can incorporate time in an analysis?
Again, Fibonacci comes to help. Great technical analysis concepts were derived from cycles. Such a concept is the Elliott Waves Theory.
Elliott built the entire theory around Fibonacci levels and ratios. But, not only when it comes to price.
Time elements were first mentioned when he divided the market in a different cycle. The cycles, or waves, have a different time component.
Like it or not, Fibonacci gives an educated guess when a specific wave/cycle might end. As such, Elliott incorporated the Fibonacci levels in the rules of the most important patterns.
Advanced Fibonacci Strategies- In Practice
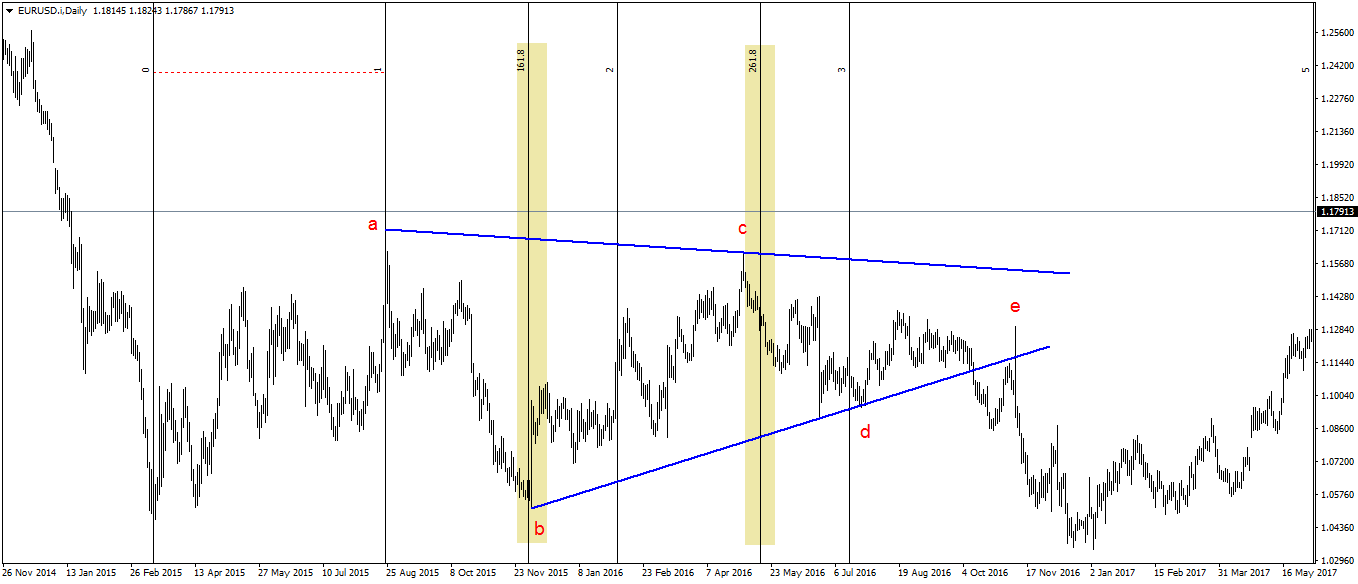
The last couple of years resulted only in consolidation on the EURUSD chart. The daily chart above shows the hesitation surrounding the pair.
But, when the market consolidates, a very probable way to do that is through a triangle.
A contracting one.
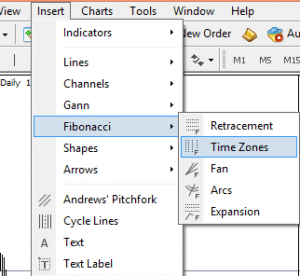
Fibonacci Time Zone
All we needed to imagine was a first swing higher. Or, the a-wave.
The idea is to measure the time taken for the first leg of the triangle. Simply click and drag the Fibonacci Time Zones from the start of the triangle until the end of the a-wave.
The resulting 161.8% and 261.8% moments in time give an educated guess about WHEN the b and c waves end. Let’s just say you just don’t want to be short, or long, but know when the time for the two waves “expires”!
Conclusion
The examples in this article are only to show how Fibonacci levels can be used differently. It’s not all about retracement and expansion.
As you can see, there are more ways to use these wonderful ratios. Moreover, with access to technology, traders find different ways to use charts. Faster too.
I wouldn’t be surprised to see, in the years to come, different types of Fibonacci analysis incorporated in the technical analysis.
But, above all, if there’s one trading theory that incorporates Fibonacci strategies, that’s the Elliot Waves Theory. The example used here is just that: an example.
The whole theory is full interpreting waves/cycles based on either price or time with Fibonacci numbers/levels/ratios.
The aim of this article is to open your eyes to the many possibilities to use the Fibonacci tools and levels. And now, I dare you: pick a currency pair and a time frame and use the four steps described earlier in this article.
The resulting dynamic support and resistance levels will be worth the try.
From that moment, we can use the Fibonacci Time Zone. This trading tool appears on the default settings of any MetaTrader platform too.
This material is written for educational purposes only. By no means do any of its contents recommend, advocate or urge the buying, selling or holding of any financial instrument whatsoever. Trading and Investing involves high levels of risk. The author expresses personal opinions and will not assume any responsibility whatsoever for the actions of the reader. The author may or may not have positions in Financial Instruments discussed in this newsletter. Future results can be dramatically different from the opinions expressed herein. Past performance does not guarantee future results.
Editors’ Picks

EUR/USD holds near 1.1900 ahead of US data
EUR/USD struggles to build on Monday's gains and fluctuates near 1.1900 on Tuesday. Markets turn cautious, lifting the haven demand for the US Dollar ahead of the release of key US economic data, including Retail Sales and ADP Employment Change 4-week average.

GBP/USD declines toward 1.3650 on renewed USD strength
GBP/USD stays on the back foot and declines to the 1.3650 region on Tuesday. The negative shift seen in risk mood helps the US Dollar (USD) gather strength and makes it difficult for the pair to find a foothold. The immediate focus is now on the US Retail Sales data.

USD/JPY drops toward 155.00 as focus shifts to US data
USD/JPY meets fresh supply and inches closer toward 155.00 in the Asian session on Tuesday. The Japanese Yen holds the upper hand over the US Dollar after Japanese Prime Minister Sanae Takaichi led the ruling Liberal Democratic Party to a historic landslide win and on intervention talks. Traders brace for key US economic data that could offer more clues on the Federal Reserve's monetary policy.
Editors’ Picks
EUR/USD holds near 1.1900 ahead of US data
EUR/USD struggles to build on Monday's gains and fluctuates near 1.1900 on Tuesday. Markets turn cautious, lifting the haven demand for the US Dollar ahead of the release of key US economic data, including Retail Sales and ADP Employment Change 4-week average.
GBP/USD declines toward 1.3650 on renewed USD strength
GBP/USD stays on the back foot and declines to the 1.3650 region on Tuesday. The negative shift seen in risk mood helps the US Dollar (USD) gather strength and makes it difficult for the pair to find a foothold. The immediate focus is now on the US Retail Sales data.

Gold stabilizes above $5,000 ahead of US data
Gold enters a consolidation phase after posting strong gains on Monday but stays above the $5,000 psychological mark and the daily swing low. US Treasury bond yields continue to edge lower on news of Chinese regulators advising financial institutions to curb holdings of US Treasuries, helping XAU/USD hold its its ground.

Bitcoin Cash trades lower, risks dead-cat bounce amid bearish signals
Bitcoin Cash trades in the red below $522 at the time of writing on Tuesday, after multiple rejections at key resistance. BCH’s derivatives and on-chain indicators point to growing bearish sentiment and raise the risk of a dead-cat bounce toward lower support levels.

Dollar drops and stocks rally: The week of reckoning for US economic data
Following a sizeable move lower in US technology Stocks last week, we have witnessed a meaningful recovery unfold. The USD Index is in a concerning position; the monthly price continues to hold the south channel support.
RECOMMENDED LESSONS
Making money in forex is easy if you know how the bankers trade!
I’m often mystified in my educational forex articles why so many traders struggle to make consistent money out of forex trading. The answer has more to do with what they don’t know than what they do know. After working in investment banks for 20 years many of which were as a Chief trader its second knowledge how to extract cash out of the market.
5 Forex News Events You Need To Know
In the fast moving world of currency markets where huge moves can seemingly come from nowhere, it is extremely important for new traders to learn about the various economic indicators and forex news events and releases that shape the markets. Indeed, quickly getting a handle on which data to look out for, what it means, and how to trade it can see new traders quickly become far more profitable and sets up the road to long term success.
Top 10 Chart Patterns Every Trader Should Know
Chart patterns are one of the most effective trading tools for a trader. They are pure price-action, and form on the basis of underlying buying and selling pressure. Chart patterns have a proven track-record, and traders use them to identify continuation or reversal signals, to open positions and identify price targets.
7 Ways to Avoid Forex Scams
The forex industry is recently seeing more and more scams. Here are 7 ways to avoid losing your money in such scams: Forex scams are becoming frequent. Michael Greenberg reports on luxurious expenses, including a submarine bought from the money taken from forex traders. Here’s another report of a forex fraud. So, how can we avoid falling in such forex scams?
What Are the 10 Fatal Mistakes Traders Make
Trading is exciting. Trading is hard. Trading is extremely hard. Some say that it takes more than 10,000 hours to master. Others believe that trading is the way to quick riches. They might be both wrong. What is important to know that no matter how experienced you are, mistakes will be part of the trading process.
The challenge: Timing the market and trader psychology
Successful trading often comes down to timing – entering and exiting trades at the right moments. Yet timing the market is notoriously difficult, largely because human psychology can derail even the best plans. Two powerful emotions in particular – fear and greed – tend to drive trading decisions off course.