I want to begin dissecting how to read price action in the context of supply and demand. In my personal trading, I do not use any indicators because I know how to read pure price action. It tells you everything you need to know. It informs you when and where the buyers and sellers are stepping in and out of the market. Now, that doesn’t mean you can’t use indicators to increase your probability, but, if you can learn how to read price action it will make you less reliant on indicators and an overall better trader. Just think, if you can read the market without any indicators, you will be a much better trader when you start to add a couple of your favorite indicators that already work for you. So, let’s start to look at a couple of examples of how I read price action. Just note, that this works on all asset classes and all time frames like the 1m, 60m, 4h, daily, weekly, monthly, etc.

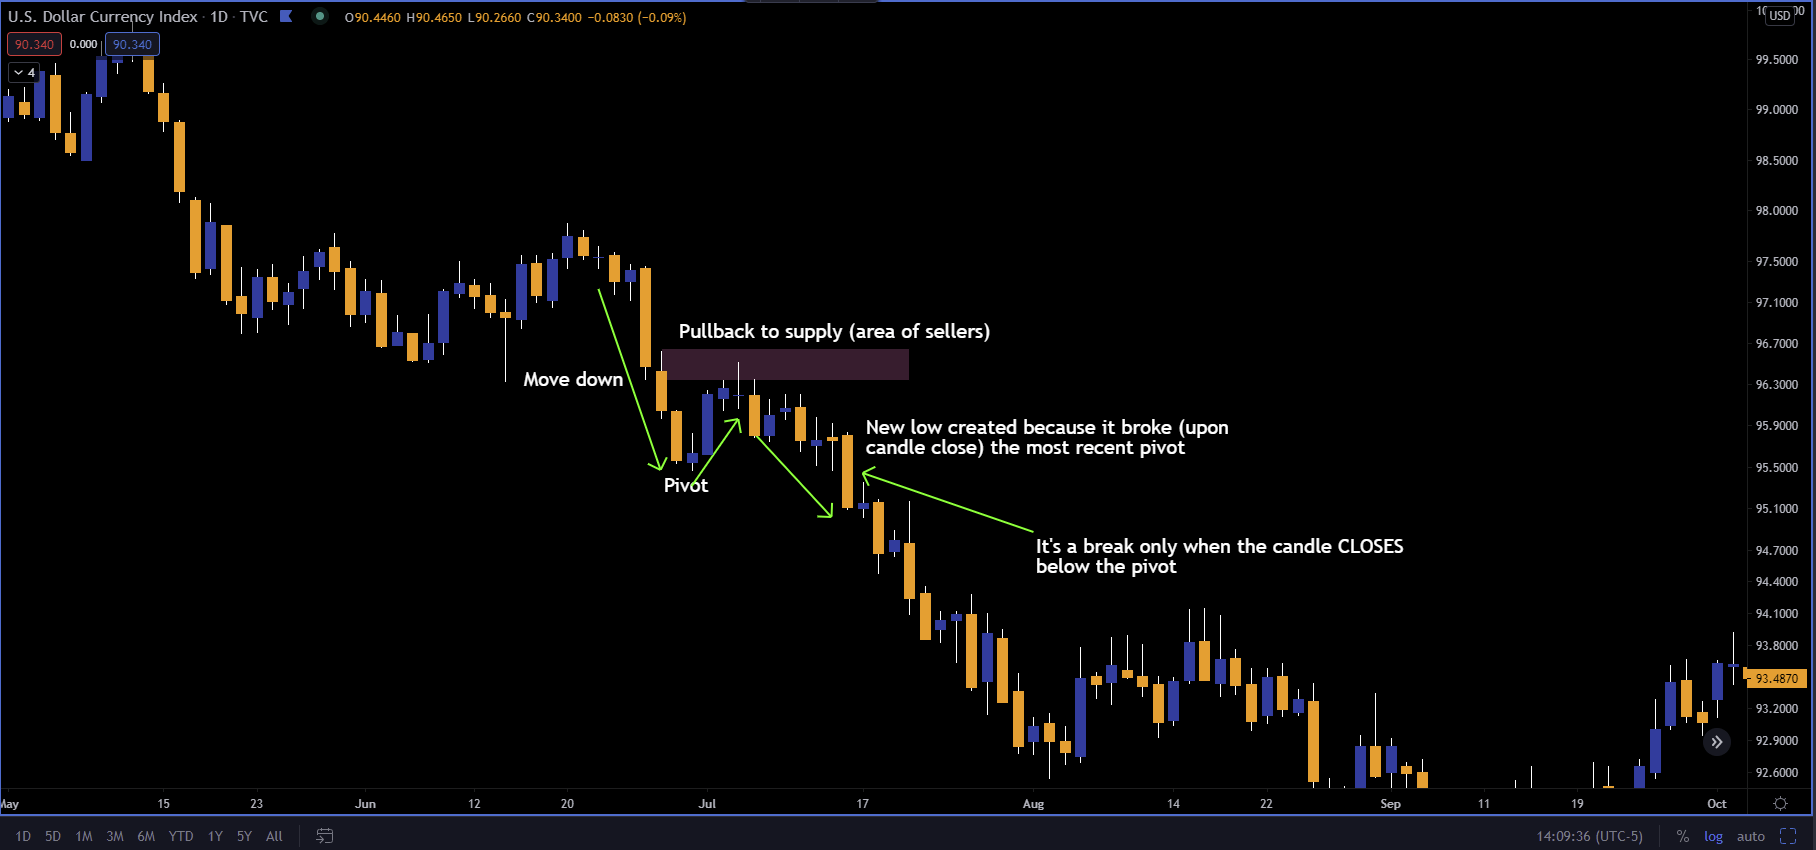
After price makes a significant move in either direction, there is always a pullback (or consolidation). When price pulls back to an opposing area of supply/demand, if the original direction is going to continue, you want to a see a new low or high created which you can see in the example below.

Chart

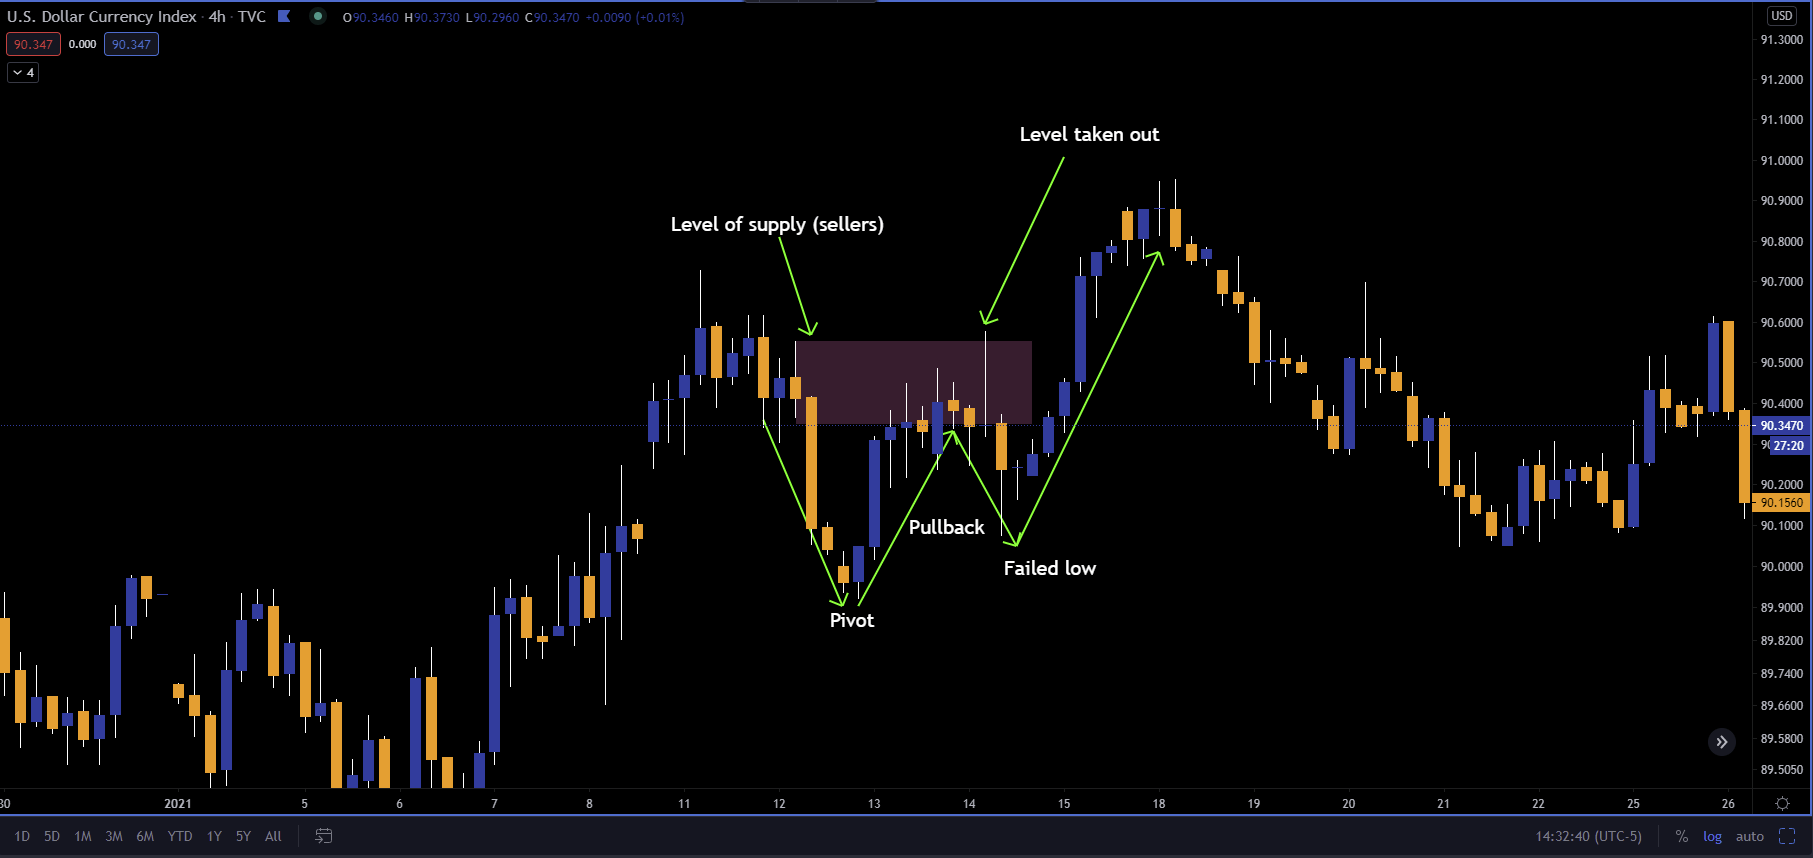
But what happens when a new low/high is not created? When price pulls back to a supply/demand level and fails to create a new low/high, that often (not always) means that price will do one of two things: price will either go deeper into the original supply/demand level or it will go through that level. Let’s take a look at an example of each.

In this 1st example (below), we can see an area of supply was formed and made a move lower, then price pulled back into that supply. Now, if the sellers are really starting to take control, we should see price react strongly out of that supply, creating a new low as it breaks the most recently formed pivot. As you can see that did not happen, price failed to create a new low and then went higher to retest that area of supply. In this case, since that area of supply had been all used up (a wick was formed that took out the entire level) price went higher, breaking through this area of supply.

Chart

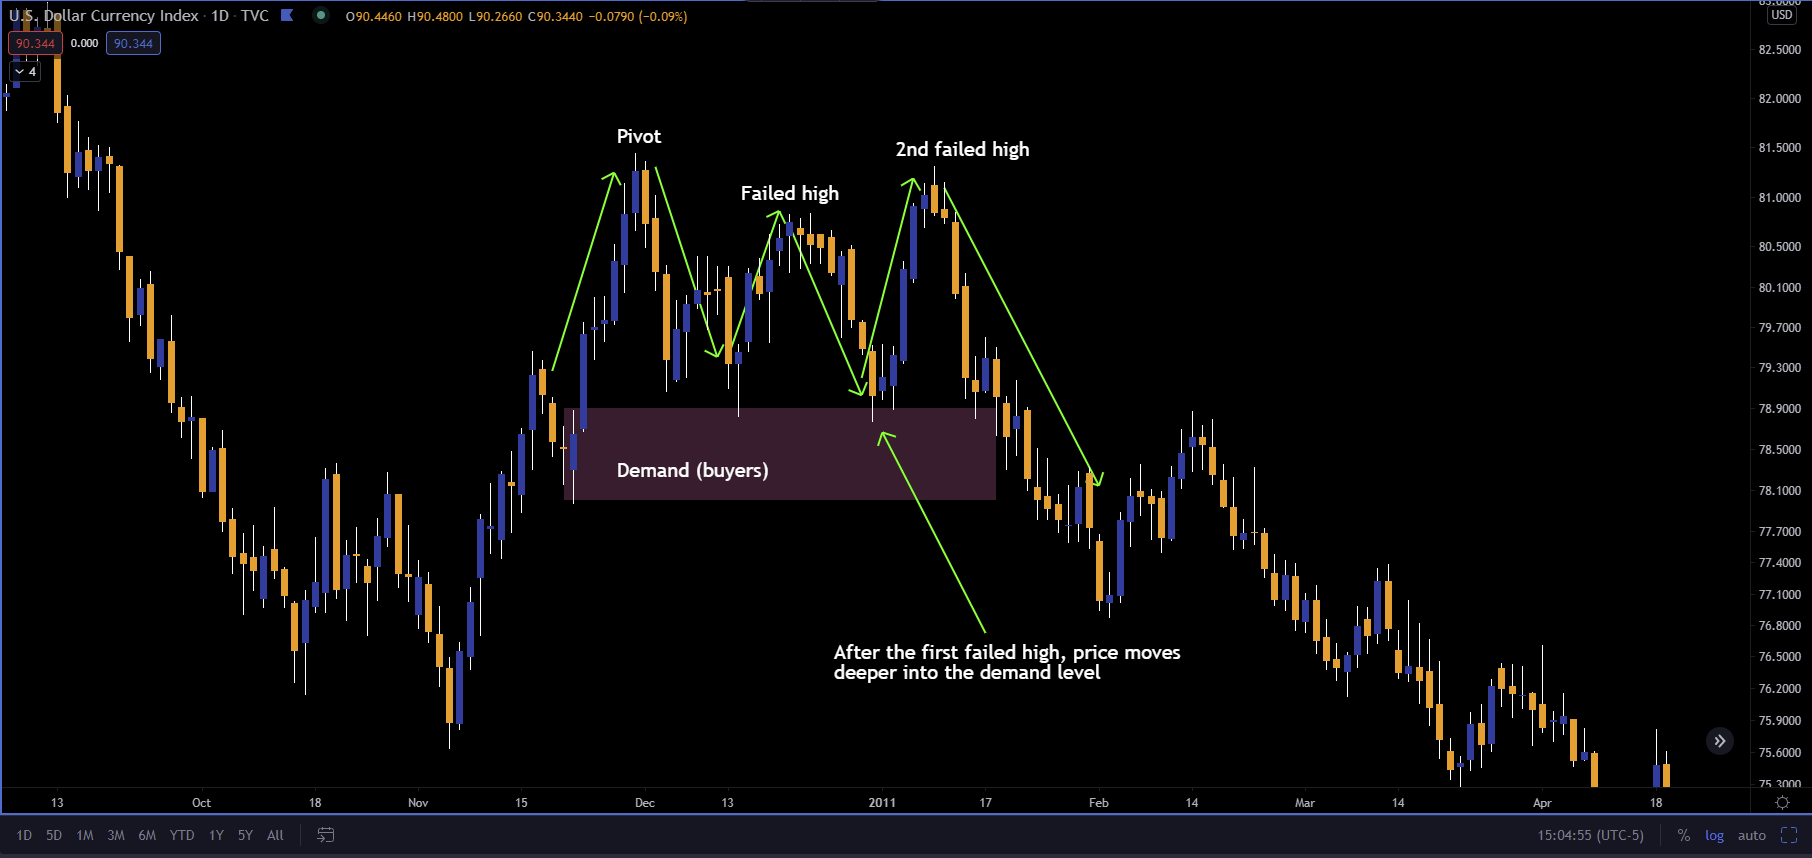
In the 2nd example (below), price fails to make a new high (because it never broke the most recently formed pivot) after pulling back to demand. Price then pulls back deeper into the demand level and fails a 2nd time to make a new high. On the 3rd test of the demand level, price breaks through it.

Chart

Notice the difference between the 1st example and the 2nd one – in the 1st example when price pulled back, it cleared out the area of sellers because it pulled back to the top of the supply level, leaving no sellers behind, allowing price to break cleanly through it. In the 2nd example, price barely touches the demand level, leaving behind a lot of buyers still waiting there when price returned. When price did finally break through, it wasn’t as clean as in the first example because there were still buyers in that area, just not enough to cause a significant turn in price.

This is price action in its purest form. You do not need indicators if you know how to read price action. That doesn’t mean you can’t use indicators, but once you know how to read price action, you will use them for their more beneficial purpose, which is to increase probability, not tell you when to buy or sell. Indicators are not reliable on their own, but when combined with price action they will be much more effective. Now, price action can go a lot deeper than this. At a later time I will get more in-depth on how this type of analysis can be actionable for you.


There is substantial risk associated with trading in the financial markets. You are solely responsible for your own financial decisions. Information on Ryan Miller Trading Economics is for educational purposes only. Ryan Miller Trading Economics will not be held responsible for any losses you incur. Ryan Miller Trading Economics does not provide any trading advice and is not a professional investment service. Past performance is not necessarily indicative of future results. There is a substantial risk of loss associated with trading currencies, securities, options, futures, equities and options on futures and currencies. Currencies, Futures, Options, Bonds, Equities and other securities trading all have large potential rewards, but they also have large potential risk and may result in monetary losses. You must be aware of the risks and be willing to accept them in order to invest or trade in these markets. Ryan Miller Trading Economics is neither a solicitation nor an offer to Buy/Sell currencies, futures, options, bonds, or equities. No representation is being made that any account will or is likely to achieve profits or losses similar to those discussed on this website. The past performance of any trading system or methodology is not necessarily indicative of future results.

Editors’ Picks

EUR/USD breaks below 1.1800, two-week lows

EUR/USD breaks below 1.1800, two-week lows

EUR/USD’s selling pressure is gathering pace now, breaching below the key 1.1800 yardstick to hit new two-week troughs on Wednesday. The pair’s pullback comes on the back of marked gains in the US Dollar following US data releases and ahead of the publication of the FOMC Minutes.

GBP/USD reaches multi-day lows near 1.3500

GBP/USD reaches multi-day lows near 1.3500

GBP/USD reverses its initial upside momentum and is now adding to previous declines, approaching the 1.3500 region on Wednesday. Cable’s downtick comes on the back of decent gains in the Greenback and easing UK inflation figures, which seem to have reinforced the case for a BoE rate cut in March.

USD/JPY holds gains near 154.00 ahead of the Fed’s minutes

USD/JPY holds gains near 154.00 ahead of the Fed’s minutes

USD/JPY retraces Tuesday's losses and returns near weekly highs in the area of 154.00. The US Dollar trims losses in quiet markets with all eyes on the Fed's minutes. Weak Japanese GDP data resurfaced concerns about Japan's fiscal stability and halted JPY's recovery.


Editors’ Picks

EUR/USD breaks below 1.1800, two-week lows

EUR/USD breaks below 1.1800, two-week lows

EUR/USD’s selling pressure is gathering pace now, breaching below the key 1.1800 yardstick to hit new two-week troughs on Wednesday. The pair’s pullback comes on the back of marked gains in the US Dollar following US data releases and ahead of the publication of the FOMC Minutes.

GBP/USD reaches multi-day lows near 1.3500

GBP/USD reaches multi-day lows near 1.3500

GBP/USD reverses its initial upside momentum and is now adding to previous declines, approaching the 1.3500 region on Wednesday. Cable’s downtick comes on the back of decent gains in the Greenback and easing UK inflation figures, which seem to have reinforced the case for a BoE rate cut in March.

Gold battle to regain $5,000 continues

Gold battle to regain $5,000 continues

Gold is back on the front foot on Wednesday, shaking off part of the early week softness and challenging two-day highs near the $5,000 mark per troy ounce. The move comes ahead of the FOMC Minutes and is unfolding despite an intense rebound in the US Dollar.

Fed Minutes to shed light on January hold decision amid hawkish rate outlook

Fed Minutes to shed light on January hold decision amid hawkish rate outlook

The Minutes of the Fed’s January 27-28 monetary policy meeting will be published today. Details of discussions on the decision to leave the policy rate unchanged will be scrutinized by investors.

Mixed UK inflation data no gamechanger for the Bank of England

Mixed UK inflation data no gamechanger for the Bank of England

Food inflation plunged in January, but service sector price pressure is proving stickier. We continue to expect Bank of England rate cuts in March and June. The latest UK inflation read is a mixed bag for the Bank of England, but we doubt it drastically changes the odds of a March rate cut.

RECOMMENDED LESSONS

5 Forex News Events You Need To Know

In the fast moving world of currency markets where huge moves can seemingly come from nowhere, it is extremely important for new traders to learn about the various economic indicators and forex news events and releases that shape the markets. Indeed, quickly getting a handle on which data to look out for, what it means, and how to trade it can see new traders quickly become far more profitable and sets up the road to long term success.

Top 10 Chart Patterns Every Trader Should Know

Chart patterns are one of the most effective trading tools for a trader. They are pure price-action, and form on the basis of underlying buying and selling pressure. Chart patterns have a proven track-record, and traders use them to identify continuation or reversal signals, to open positions and identify price targets.

7 Ways to Avoid Forex Scams

The forex industry is recently seeing more and more scams. Here are 7 ways to avoid losing your money in such scams: Forex scams are becoming frequent. Michael Greenberg reports on luxurious expenses, including a submarine bought from the money taken from forex traders. Here’s another report of a forex fraud. So, how can we avoid falling in such forex scams?

What Are the 10 Fatal Mistakes Traders Make

Trading is exciting. Trading is hard. Trading is extremely hard. Some say that it takes more than 10,000 hours to master. Others believe that trading is the way to quick riches. They might be both wrong. What is important to know that no matter how experienced you are, mistakes will be part of the trading process.

Strategy

Money Management

Psychology

Best Brokers of 2025