Zilliqa Price Prediction: ZIL aims for $0.26 as the odds flip in favor of the bulls
- Zilliqa price is contained inside an ascending broadening wedge pattern on the 4-hour chart.
- The digital asset intends to establish a higher low and confirm an uptrend.
- ZIL must stay above a crucial support level to see a potential 27% upswing.

Zilliqa price established a downtrend in the past four days but is close to a recovery. The digital asset is trading at $0.204 at the time of writing, above a crucial support level and is aiming for a significant breakout toward all-time highs.
Zilliqa price must conquer this level to see all-time highs
On the 4-hour chart, Zilliqa has established an ascending broadening pattern which can be drawn connecting the higher highs and lower highs with two different trendlines. As the name suggests, this pattern gets broader as time goes by.
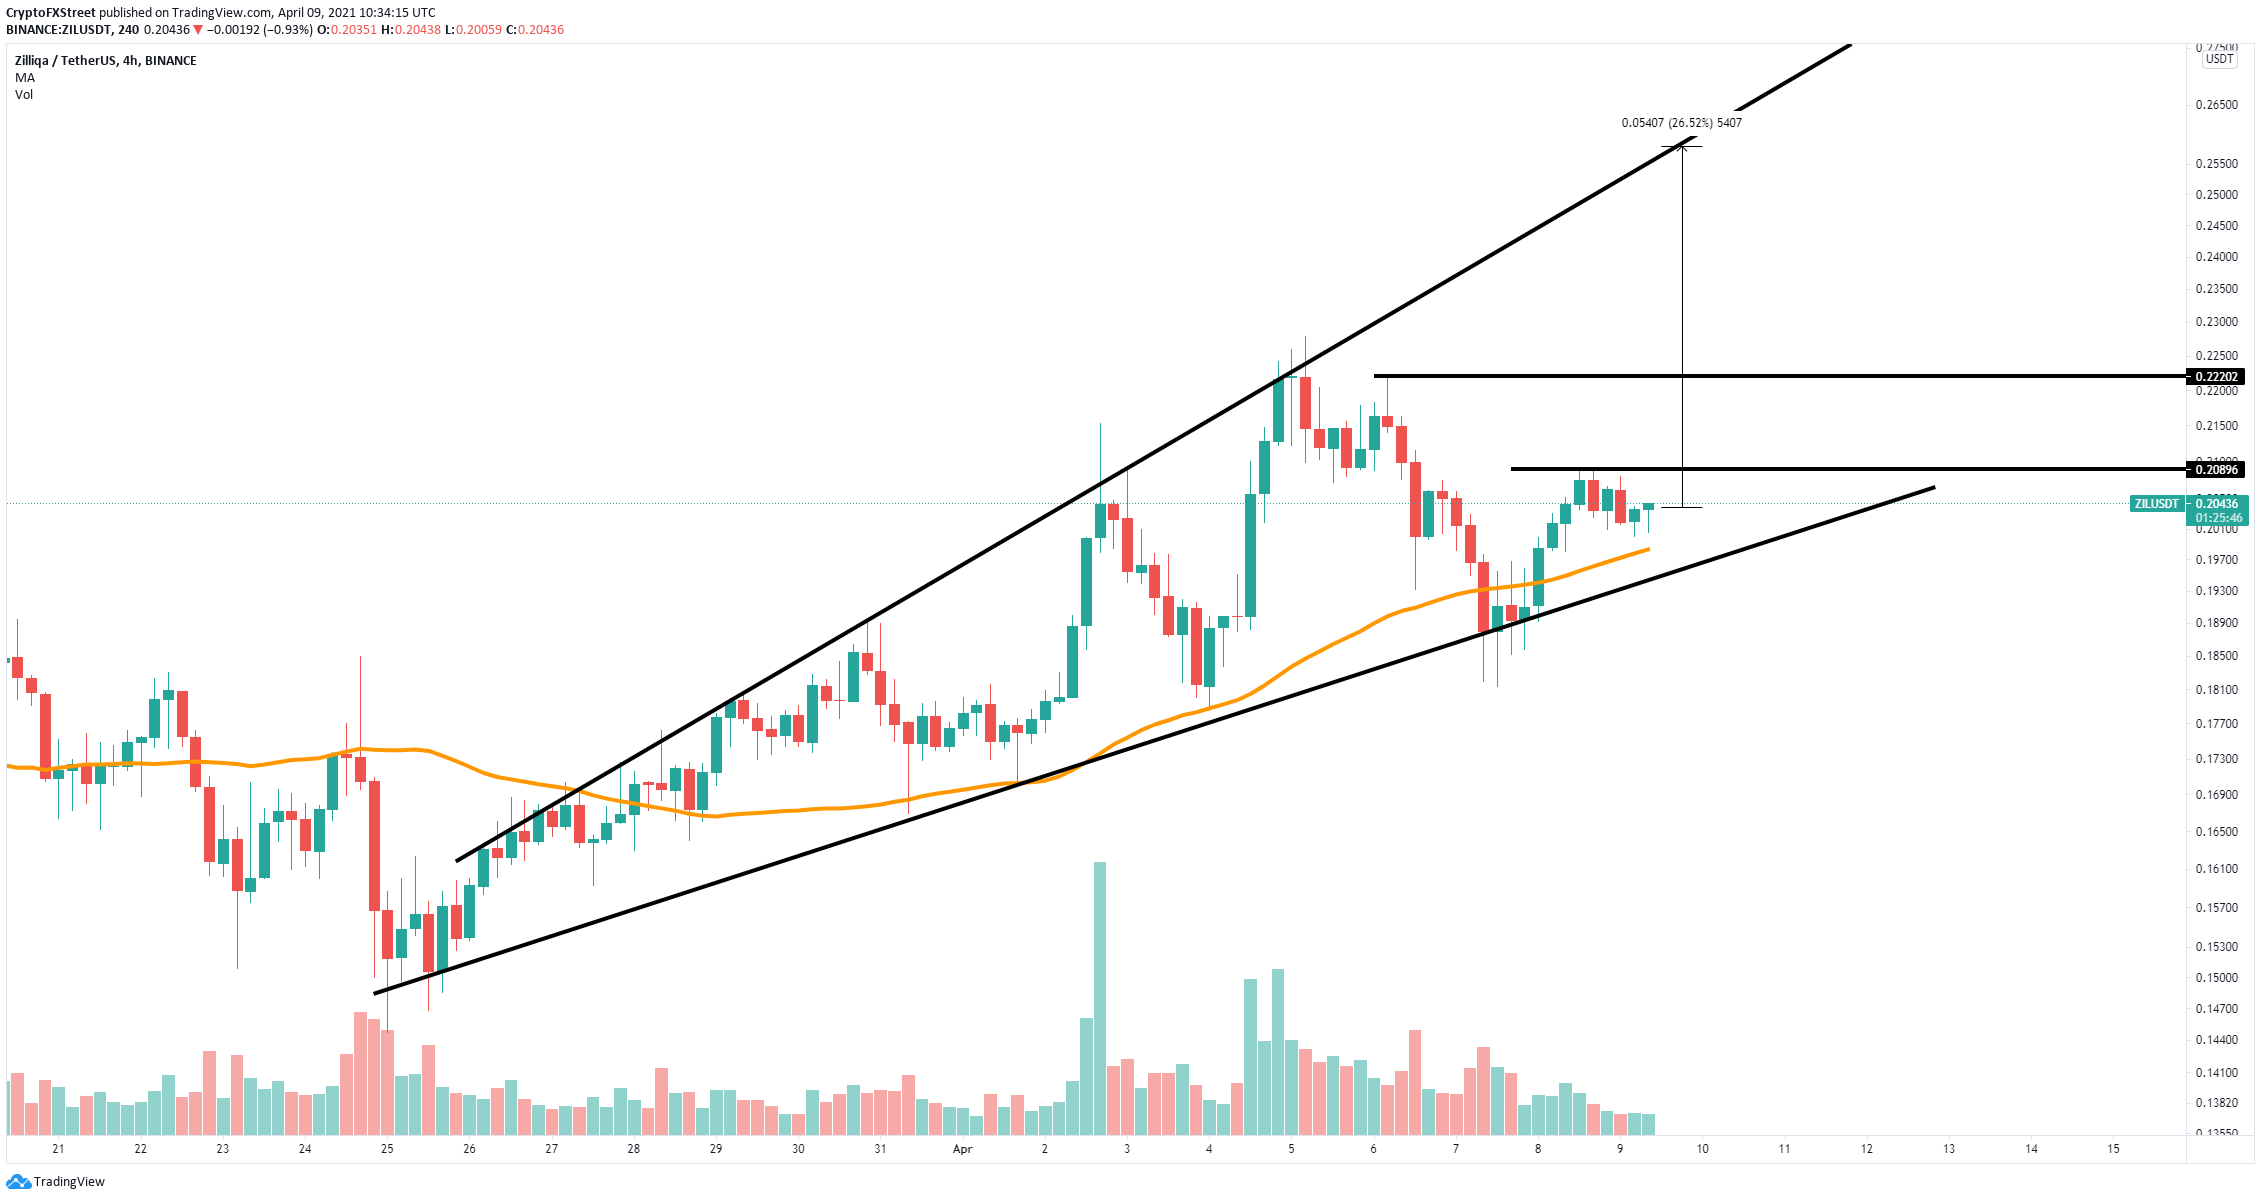
ZIL/USD 4-hour chart
Ascending broadening wedges tend to break out in the direction of the previous price trend. However, a breakout is far away from the current price. Zilliqa bulls want to establish a higher low compared to $0.181 and a higher high above $0.208 to confirm an uptrend.
Bulls have managed to defend the 50 SMA support level at $0.20 so far. A breakout above $0.208 should quickly push Zilliqa price towards $0.222 in the short term, and as high as $0.26 at the top of the pattern in the longer term.
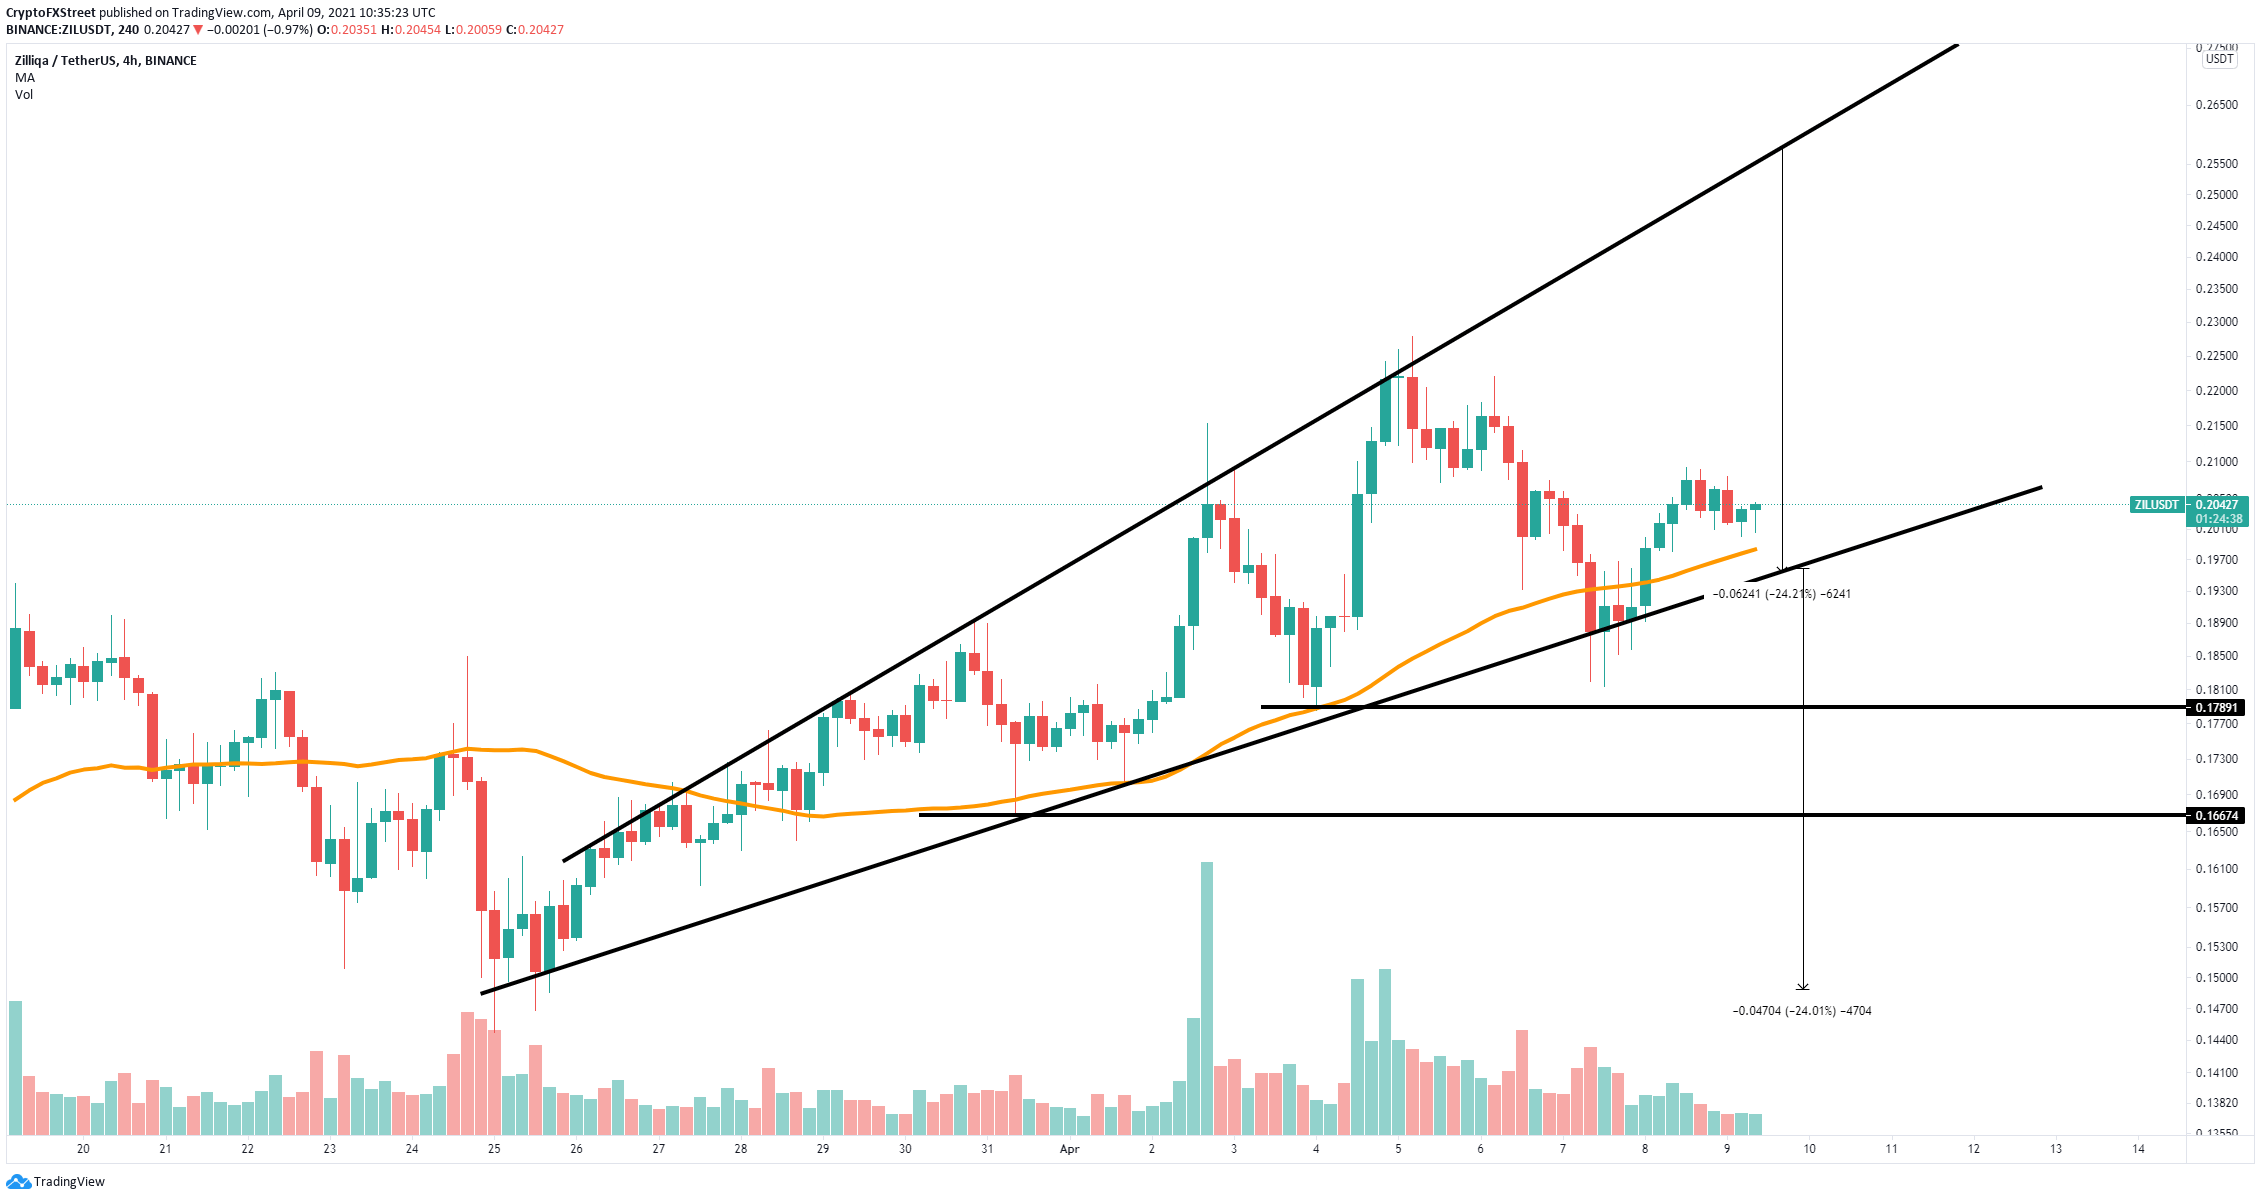
ZIL/USD 4-hour chart
However, a breakdown below the crucial support trendline of the wedge at $0.195 will lead Zilliqa price towards a maximum low of $0.148, calculated using the height from the breakdown point to the upper trendline.
Other bearish price targets in between include $0.178, a low formed on April 4, and $0.167, another low formed on March 31.
Author

Lorenzo Stroe
Independent Analyst
Lorenzo is an experienced Technical Analyst and Content Writer who has been working in the cryptocurrency industry since 2012. He also has a passion for trading.



