Zilliqa Price Analysis: ZIL primed for another liftoff to new record highs
- Zilliqa hit a temporary hurdle at $2, but bulls have eyes glued on $0.3.
- The Parabolic SAR has a bullish outlook, giving credence to the expected upswing.
- ZIL may retreat to $0.145 if the 50 SMA support on the 4-hour chart cracks.

Zilliqa's persistent upward roll has faced intense resistance twice at $0.2. The initial correction saw the bulls hold firmly to the support at $0.145, which the 50 Simple Moving Average reinforced. The recovery that ensued failed to clear the hurdle at $0.2, explaining the trading at $0.17. Meanwhile, technical levels have started to improve, with Zilliqa eyeing new all-time highs.
Zilliqa uptrend depends on improving technical levels
The Moving Average Convergence Divergence (MACD) has settled above the mean line. The cross above the signal line was a significant bullish signal. If the MACD sustains the uptrend and the divergence above the midline, we will likely see an upswing toward a new all-time high.
However, the 50 SMA on the 4-hour chart must hold to avert potential declines to $0.145. The action above the stubborn resistance at $2 may trigger massive buy orders as the fear of missing out (FOMO) grips investors. Further up, bulls have their eyes glued on $0.3.
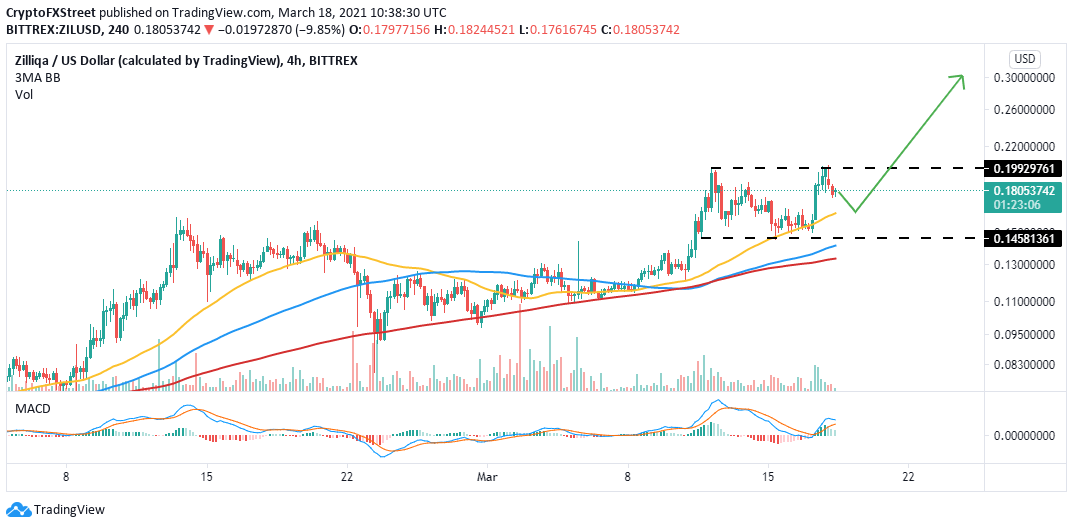
ZIL/USD 4-hour chart
The same 4-hour chart shows that the Parabolic SAR points have just flipped bullish. This indicator tracks the asset's momentum and reveals when it turns from bullish to bearish and vice versa. The trend is upwards, as highlighted by the Parabolas (dots) being under the price. Moreover, the Relative Strength Index (RSI) is heading back to the overbought region, confirming the bullish narrative.
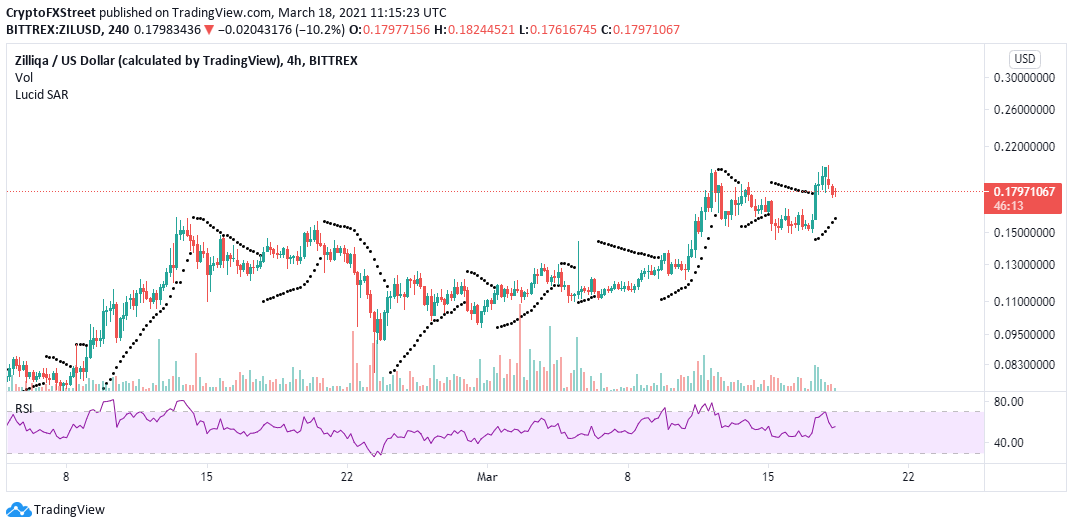
ZIL/USD 4-hour chart
Looking at the other side of the fence
Support at the 50 SMA on the 4-hour chart must hold to ensure that losses do not come into the picture. Triggering sell orders would be detrimental to the progress made over the last few days and lead to extend losses under $0.1. Other key support areas to have in mind are $0.145, the 100 SMA, and 200 SMA.
Author

John Isige
FXStreet
John Isige is a seasoned cryptocurrency journalist and markets analyst committed to delivering high-quality, actionable insights tailored to traders, investors, and crypto enthusiasts. He enjoys deep dives into emerging Web3 tren


